


Positions of large speculators according to the COT report as at 15/2/2022
Total net speculator positions in the USD index rose by 1,621 contracts last week. This change is the result of an increase in long positions by 1,979 contracts and an increase in short positions by 358 contracts.
Growth in total net speculator positions occurred last week in the euro, the British pound and the New Zealand dollar.
Decrease in total net positions occurred in the Australian dollar, the Japanese yen, the Canadian dollar, and the Swiss franc.
The positions of speculators in individual currencies
The total net positions of large speculators are shown in table 1: If the value is positive then the large speculators are net long. If the value is negative, the large speculators are net short.
|
Date |
USD Index |
EUR |
GBP |
AUD |
NZD |
JPY |
CAD |
CHF |
|---|---|---|---|---|---|---|---|---|
|
Feb 15, 2022 |
35386 |
47581 |
2237 |
-86694 |
-9333 |
-66162 |
12170 |
-9715 |
|
Feb 08, 2022 |
33765 |
38842 |
-8545 |
-85741 |
-10366 |
-59148 |
14886 |
-9399 |
|
Feb 01, 2022 |
34571 |
29716 |
-23605 |
-79829 |
-11698 |
-60640 |
18264 |
-8239 |
|
Jan 25, 2022 |
36861 |
31560 |
-7763 |
-83273 |
-10773 |
-68273 |
12317 |
-8796 |
|
Jan 18, 2022 |
36434 |
24584 |
-247 |
-88454 |
-8331 |
-80879 |
7492 |
-10810 |
|
Jan 11, 2022 |
37892 |
6005 |
-29166 |
-91486 |
-8604 |
-87525 |
-7376 |
-7660 |
Note: The explanation of COT methodolody is at the end of this report.
Notes:
- Large speculators are traders who trade large volumes of futures contracts, which, if the set limits are met, must be reported to the Commodity Futures Trading Commission. Typically, this includes traders such as funds or large banks. These traders mostly focus on trading long-term trends and their goal is to make money on speculation with the instrument.
- The total net positions of large speculators are the difference between the number of long contracts and the number of short contracts of large speculators. Positive value shows that large speculators are net long. Negative value shows that large speculators are net short. The data is published every Friday and is delayed because it shows the status on Tuesday of the week.
- The total net positions of large speculators show the sentiment this group has in the market. A positive value of the total net positions of speculators indicates bullish sentiment, a negative value of total net positions indicates bearish sentiment.
- When interpreting charts and values, it is important to follow the overall trend of total net positions. The turning points are also very important, i.e. the moments when the total net positions go from a positive value to a negative one and vice versa. Important are also extreme values of total net positions as they often serve as signals of a trend reversal.
- Sentiment according to the reported positions of large players in futures markets is not immediately reflected in the movement of currency pairs. Therefore, information on sentiment is more likely to be used by traders who take longer trades and are willing to hold their positions for several weeks or even months.
Detailed analysis of selected currencies
Explanations:
- Purple line and histogram: this is information on the total net position of large speculators. This information shows the strength and sentiment of an ongoing trend. It is the indicator r_COT Large Speculators (by Kramsken) in www.tradingview.com.
- Information on the positions of so-called hedgers is not shown in the chart, due to the fact that their main goal is not speculation, but hedging. Therefore, this group usually takes the opposite positions than the large speculators. For this reason, the positions of hedgers are inversely correlated with the movement of the price of the underlying asset. However, this inverse correlation shows the ongoing trend less clearly than the position of large speculators.
- We show moving average SMA 100 (blue line) and EMA 50 (orange line) on daily charts.
Charts are made with the use of www.tradingview.com. The source of numerical data is www.myfxbook.com
Euro
|
date |
Open Interest |
Specs Long |
Specs Short |
Specs Net positions |
change Open Interest |
change Long |
change Short |
change Net Positions |
Sentiment |
|---|---|---|---|---|---|---|---|---|---|
|
Feb 15, 2022 |
702047 |
217899 |
170318 |
47581 |
1949 |
-1074 |
-9813 |
8739 |
Bullish |
|
Feb 08, 2022 |
700098 |
218973 |
180131 |
38842 |
14667 |
5410 |
-3716 |
9126 |
Bullish |
|
Feb 01, 2022 |
685431 |
213563 |
183847 |
29716 |
2479 |
155 |
1999 |
-1844 |
Weak bullish |
|
Jan 25, 2022 |
682952 |
213408 |
181848 |
31560 |
-8930 |
1507 |
-5469 |
6976 |
Bullish |
|
Jan 18, 2022 |
691882 |
211901 |
187317 |
24584 |
9589 |
7540 |
-11039 |
18579 |
Bullish |
|
Jan 11, 2022 |
682293 |
204361 |
198356 |
6005 |
4075 |
5288 |
-2271 |
7559 |
Bullish |
|
Total change |
23829 |
18826 |
-30309 |
49135 |

Figure 1: The euro and COT positions of large speculators on a weekly chart and the EURUSD on D1
The total net positions of speculators reached 47,581 contracts last week, up by 8,739 contracts compared to the previous week. This change is due to a decrease in long positions by 1,074 contracts and a decrease in short positions by 9,813 contracts.
Total net speculators positions have increased by 49,135 contracts over the past 6 weeks. This change is due to speculators closing 30,309 short positions and adding 18,826 long positions. This data suggests continued bullish sentiment for the euro.
However, the rising open interest, which increased by 1,949 contracts in the last week, shows the opposite, as the euro fell down last week and this decline is supported by the rising number of open interest contracts. So more bearish traders were in the market. So we have conflicting information here.
The euro weakened slightly last week on fears of an escalation of the conflict between Russia and Ukraine.
Long-term resistance: 1.1461 – 1.15
Support: 1.1280 - 1.1300. Next support is near 1.1220 - 1.1240. A strong support is in 1.1120-1.1140.
The British Pound
|
date |
Open Interest |
Specs Long |
Specs Short |
Specs Net positions |
change Open Interest |
change Long |
change Short |
change Net Positions |
Sentiment |
|---|---|---|---|---|---|---|---|---|---|
|
Feb 15, 2022 |
195302 |
50151 |
47914 |
2237 |
-2646 |
5442 |
-5340 |
10782 |
Bullish |
|
Feb 08, 2022 |
197948 |
44709 |
53254 |
-8545 |
13941 |
15112 |
52 |
15060 |
Weak bearish |
|
Feb 01, 2022 |
184007 |
29597 |
53202 |
-23605 |
1967 |
-7069 |
8773 |
-15842 |
Bearish |
|
Jan 25, 2022 |
182040 |
36666 |
44429 |
-7763 |
-1194 |
-3094 |
4422 |
-7516 |
Bearish |
|
Jan 18, 2022 |
183234 |
39760 |
40007 |
-247 |
-17259 |
9254 |
-19665 |
28919 |
Weak bearish |
|
Jan 11, 2022 |
200493 |
30506 |
59672 |
-29166 |
486 |
4526 |
-5479 |
10005 |
Weak bearish |
|
Total change |
-4705 |
24171 |
-17237 |
41408 |
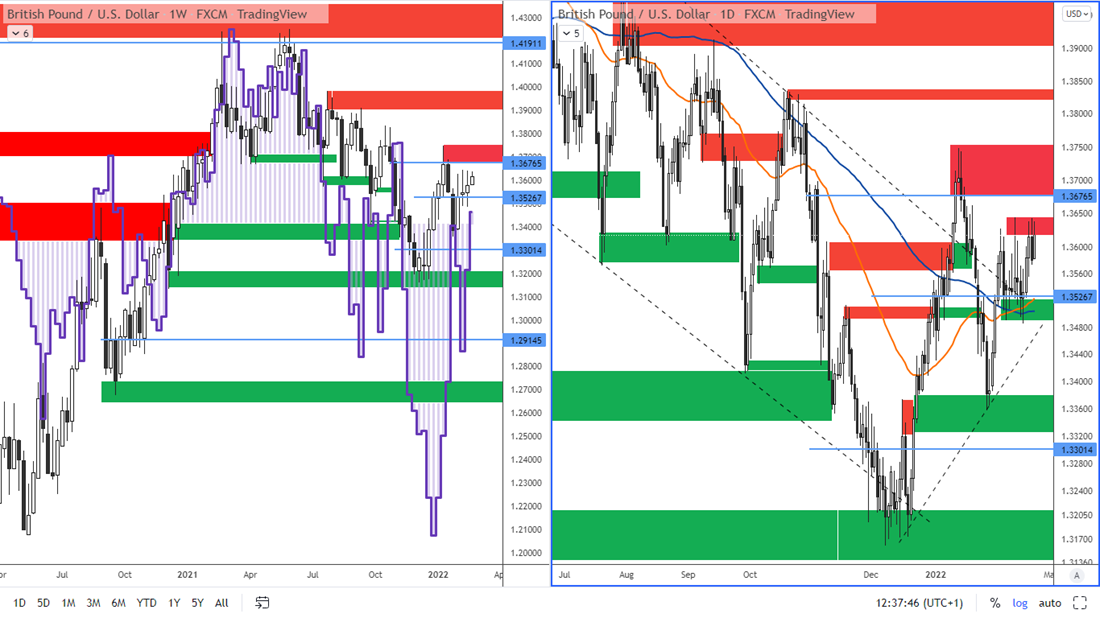
Figure 2: The GBP and COT positions of large speculators on a weekly chart and the GBPUSD on D1
The total net positions of speculators reached 2,237 contracts last week, up by 10,782 contracts compared to the previous week. This change is due to an increase in long positions of 5,442 contracts and a decrease in short positions of 5,340 contracts.
Total net positions have increased by 41,408 contracts over the past 6 weeks. This change is due to speculators exiting 17,237 short positions and adding 24,171 long positions.
This data suggests bullish sentiment for the pound.
Open interest, which fell by 2,646 contracts last week, is indicating that the bullish price action that occurred in the pound last week was not supported by volume and therefore it is weak.
Risk off sentiment in US equities could have a negative effect on the Pound as well as the Euro, which could then send the Pound towards support which is at 1.3380.
Long-term resistance: 1.3620-1.3640. Next resistance is near 1.3680 – 1.3750.
Support: 1.3490 – 1.3520. A next support is near 1.3320 – 1.3380 and then mainly in the zone near 1.3200.
The Australian dollar
|
Date |
Open Interest |
Specs Long |
Specs Short |
Specs Net positions |
change Open Interest |
change Long |
change Short |
change Net Positions |
Sentiment |
|---|---|---|---|---|---|---|---|---|---|
|
Feb 15, 2022 |
192578 |
11692 |
98386 |
-86694 |
-3825 |
-5631 |
-4678 |
-953 |
Bearish |
|
Feb 08, 2022 |
196403 |
17323 |
103064 |
-85741 |
-510 |
-1512 |
4400 |
-5912 |
Bearish |
|
Feb 01, 2022 |
196913 |
18835 |
98664 |
-79829 |
6893 |
3714 |
270 |
3444 |
Weak bearish |
|
Jan 25, 2022 |
190020 |
15121 |
98394 |
-83273 |
8884 |
6070 |
889 |
5181 |
Weak bearish |
|
Jan 18, 2022 |
181136 |
9051 |
97505 |
-88454 |
-4317 |
-3332 |
-6364 |
3032 |
Weak bearish |
|
Jan 11, 2022 |
185453 |
12383 |
103869 |
-91486 |
5346 |
-249 |
1871 |
-2120 |
Bearish |
|
Total change |
12471 |
-940 |
-3612 |
2672 |

Figure 3: The AUD and COT positions of large speculators on a weekly chart and the AUDUSD on D1
Total net speculator positions last week reached -86,694 contracts, down 953 contracts from the previous week. This change is due to a decrease in long positions of 5,631 contracts and a decrease in short positions of 4,678 contracts. This data suggests continued bearish sentiment on the Australian dollar, which is confirmed by the downtrend.
Total net positions have increased by 2,672 contracts over the past 6 weeks. This change is due to speculators exit of 3,612 short contracts while exiting 940 long contracts at the same time.
However, last week saw a decrease in open interest of 3,825 contracts. This means that the upward price action that occurred last week was weak in terms of volume because new money did not flow into the market.
The Australian dollar is very sensitive to the international geopolitical situation. If the conflict between Russia and Ukraine escalates, we can expect it to weaken especially on the AUDUSD pair and also the AUDJPY.
Long-term resistance: 0.7200-0.7250 and especially near 0.7270-0.7310.
Long-term support: 0.7085-0.7120. A strong support is near 0.6960 – 0.6990.
The New Zealand dollar
|
Date |
Open Interest |
Specs Long |
Specs Short |
Specs Net positions |
Change Open Interest |
Change Long |
Change Short |
Change Net Positions |
Sentiment |
|---|---|---|---|---|---|---|---|---|---|
|
Feb 15, 2022 |
64105 |
24923 |
34256 |
-9333 |
9228 |
7755 |
6722 |
1033 |
Weak bearish |
|
Feb 08, 2022 |
54877 |
17168 |
27534 |
-10366 |
-3590 |
-2037 |
-3369 |
1332 |
Weak bearish |
|
Feb 01, 2022 |
58467 |
19205 |
30903 |
-11698 |
5151 |
3257 |
4182 |
-925 |
Bearish |
|
Jan 25, 2022 |
53316 |
15948 |
26721 |
-10773 |
8589 |
4336 |
6778 |
-2442 |
Bearish |
|
Jan 18, 2022 |
44727 |
11612 |
19943 |
-8331 |
2661 |
652 |
379 |
273 |
Weak bearish |
|
Jan 11, 2022 |
42066 |
10960 |
19564 |
-8604 |
1764 |
1543 |
1302 |
241 |
Weak bearish |
|
Celková změna |
23803 |
15506 |
15994 |
-488 |
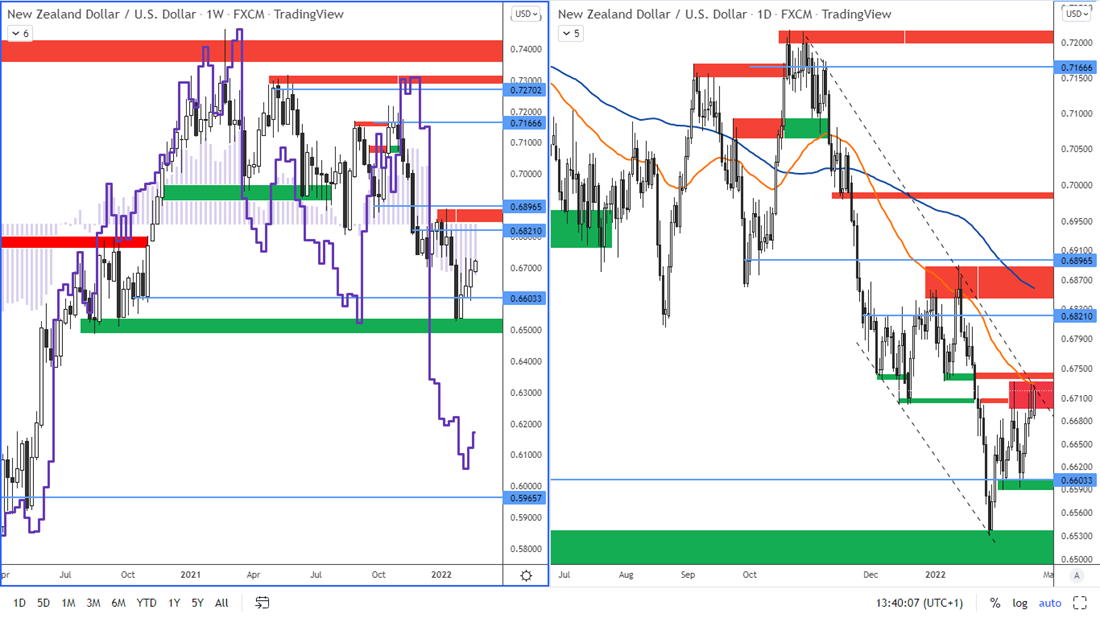
Figure 4: The NZD and the position of large speculators on a weekly chart and the NZDUSD on D1
The total net positions of speculators reached a negative value last week - 9,333 contracts, having increased by 1,033 contracts compared to the previous week. This change is due to an increase in long positions by 7,755 contracts and an increase in short positions by 6,722 contracts. This data suggests that the bearish sentiment for the New Zealand Dollar continues, but has started to weaken over the past week.
Total net positions have declined by 488 contracts over the past 6 weeks. This change is due to speculators adding 15,994 short positions and adding 15,506 long positions.
Open interest rose significantly last week, increasing by 9,228 contracts. The rise in the NZDUSD price action that occurred last week is therefore supported by volume and therefore the move was strong.
The reason for the NZD strengthening last week is that the Reserve Bank of New Zealand is likely to raise interest rates to 1% on Feb 23, 2022. However, if the conflict in Ukraine escalates further, the NZDUSD could more likely weaken. The reason for the NZDUSD's decline from a technical analysis perspective could also be that the NZDUSD price has reached horizontal resistance and also the upper downtrend line from the daily chart.
Long-term resistance: 0.6700 – 0.6740 and then 0.6850 – 0.6890.
Long-term support: 0.6590-0.6600 and the next support is at 0.6500 – 0.6530.
Explanation to the COT report
- The COT report shows the positions of major participants in the futures markets. Futures contracts are derivatives and are essentially agreements between two parties to exchange an underlying asset for a predetermined price on a predetermined date. They are standardised, specifying the quality and quantity of the underlying asset. They are traded on an exchange so that the total volume of these contracts traded is known.
- Open interest: open interest is the sum of all open futures contracts (i.e. the sum of short and long contracts) that exist on a given asset. OI increases when a new futures contract is created by pairing a buyer with a seller. The OI decreases when an existing futures contract expires at a given expiry time or by settlement.
- Low or no open interest means that there is no interest in the market. High open interest indicates high activity and traders pay attention to this market. A rising open interest indicates that there is demand for the currency. That is, a rising OI indicates a strong current trend. Conversely, a weakening open interest indicates that the current trend is not strong.
|
Open Interest |
Price action |
Interpretation |
Notes |
|---|---|---|---|
|
Rising |
Rising |
Strong bullish market |
New money flow in the particular asset, more bulls entered the market which pushes the price up. The trend is strong. |
|
Rising |
Falling |
Strong bearish market |
Price falls, more bearish traders entered the market which pushes the price down. The trend is strong. |
|
Falling |
Rising |
Weak bullish market |
Price is going up but new money do not flow into the market. Existing futures contracts expire or are closed. The trend is weak. |
|
Falling |
Falling |
Weak bearish market |
Price is going down, but new money do not flow into the market. Existing futures expire or are closed, the trend is weak. |
- Large speculators are traders who trade large volumes of futures contracts, which, if the set limits are met, must be reported to the Commodity Futures Trading Commission. Typically, this includes traders such as funds or large banks. These traders mostly focus on trading long-term trends and their goal is to make money on speculation with the instrument. Traders should try to trade in the direction of these large speculators.
- The total net positions of large speculators are the difference between the number of long contracts and the number of short contracts of large speculators. Positive value shows that large speculators are net long. Negative value shows that large speculators are net short. The data is published every Friday and is delayed because it shows the status on Tuesday of the week.
- The total net positions of large speculators show the sentiment this group has in the market. A positive value of the total net positions of speculators indicates bullish sentiment, a negative value of total net positions indicates bearish sentiment.
- When interpreting charts and values, it is important to follow the overall trend of total net positions. The turning points are also very important, i.e. the moments when the total net positions go from a positive value to a negative one and vice versa. Important are also extreme values of total net positions as they often serve as signals of a trend reversal.
- The COT data are usually reported every Friday and they show the status on Tuesday of the week.
- Sentiment according to the reported positions of large players in futures markets is not immediately reflected in the movement of currency pairs. Therefore, information on sentiment is more likely to be used by traders who take longer trades and are willing to hold their positions for several weeks or even months.


![Turbulent Q2'23 Results for [Company Name]: Strong Exports Offset Domestic Challenges](https://www.fxmag.com/media/cache/main_box_filter/uploads/articles/2022-FXMAG-COM/GPWA/gpw-s-analytical-coverage-support-programme-wse-2-6311cd4191809-2022-09-02-11-30-41-63175bda84812-2022-09-06-16-40-26.png "Warsaw Stock Exchange: Brand24 (B24) - 1Q23 financial results")


![Turbulent Q2'23 Results for [Company Name]: Strong Exports Offset Domestic Challenges](https://www.fxmag.com/media/cache/article_small_filter/uploads/articles/2022-FXMAG-COM/GPWA/gpw-s-analytical-coverage-support-programme-wse-2-6311cd4191809-2022-09-02-11-30-41-63175bda84812-2022-09-06-16-40-26.png "Warsaw Stock Exchange: Brand24 (B24) - 1Q23 financial results")

