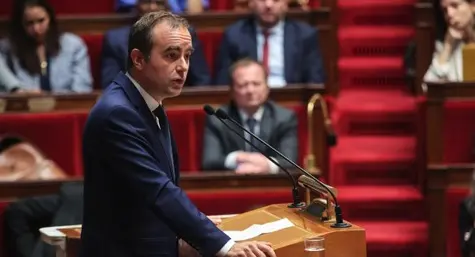
France’s Social Security Budget Passes by Narrow Margin, Raising Fiscal Risks for 2026
France passed its social security budget, but the state budget remains unresolved, and the deficit outlook is worsening
France passed its social security budget, but the state budget remains unresolved, and the deficit outlook is worsening

Positive signals from both the US and Ukraine regarding a Russia-Ukraine peace deal continue to put pressure on energy markets. However, there’s little clarity on where Russia stands on the current plan

Intuitively, a deal with Russia would help euro rates higher, but falling gas futures are already pushing down the curve through lower inflation expectations. Tensions with Russia are likely to stay, which means risk sentiment should remain fragile

Oil prices rose yesterday, in step with a global equity rally. However, peace talks remain a crucial area of uncertainty for the market


The week draws to a close on a positive note after a significant selloff in risk assets as US rate cut bets continued to decline from the Federal Reserve's December meeting.

Oil prices are under renewed pressure amid ongoing peace talks to end the war in Ukraine

Oil prices moved higher yesterday amid lingering supply risks, and a stronger diesel market lent additional support

Tepid pricing in the industry and weakening price dynamics in agriculture are a downward risk for consumer prices. If consumer spending remains steady, inflation is likely to hover around the target over the upcoming year. A combination of factors might result in a low-inflation environment

Wage growth was slightly higher than expected in September. This growth in purchasing power could overcome the Hungarian economy’s Achilles heel: a lack of confidence. In the coming months, inflation will fall and wages will grow strongly

At a calm press briefing, the National Bank of Romania unveiled its November Inflation Report, announcing upward revisions to its inflation trajectory. The overall message conveyed stability, indicating that the Bank remains on a steady course despite the higher projections

The drop in USD this week seems to be linked to expectations that US data will come in soft. But hearing Fed speakers, the move seems a bit premature, even if it looks like we could get September payrolls data soon. In the UK, the government is scrapping its income tax hike plans. GBP downside risks have suddenly increased

Earlier this summer, German Chancellor Friedrich Merz promised a 'Fall of reforms'. This week, the government moved to accelerate decision-making, unveiling a fresh set of policy announcements within just the past 24 hours

Bank Indonesia and the People’s Bank of China are both expected to maintain current interest rate levels. Key releases include Japan's GDP, trade figures, and inflation, Taiwan's export orders and Singapore's GDP

The carry trade suffered a stress test yesterday, when one popular target currency, the Hungarian forint, had to cope with prospects of wider budget deficits. After selling off 0.7%, the forint is already coming back bid. With volatility expected to stay low, it's hard to see any major unwinds of carry strategies in the near term

South Korea’s jobless rate rose in October, but it remains below 3%. The Bank of Korea is expected to keep policy unchanged in November amid concerns about property risk and volatile foreign exchange markets

Third-quarter GDP growth disappointed at 4.0% YoY, dragged down by weak investment and softer government spending, while exports provided temporary support. We downgrade our 2025 growth forecast to 4.7% (from 5.2%) as sentiment weakens and tariff headwinds loom, reinforcing our call for a 25bp central bank rate cut in December

Oil prices settled lower yesterday with a large increase in US crude oil inventories, while surplus expectations for the global oil market will also be providing some headwinds

The risk mood has darkened a little this week, with some sizeable corrections emerging in some equity markets. There has not been one catalyst per se, but lofty valuations must be leading to some profit-taking in uncertain conditions. For today, it's all about the US ADP jobs release and what it means for the December Fed meeting. Expect FX to stay defensive

Increased Chinese competition within Europe and in third markets has been a trend that restarted with Covid, and may intensify now as a result of global trade tensions. While stronger Chinese competition can potentially mute eurozone inflation and GDP growth, it is also likely to aggravate problems in key industries
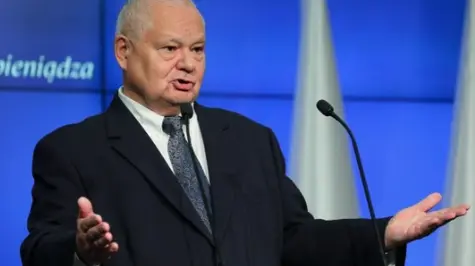
The National Bank of Poland (NBP) has repeatedly warned of upside risks to inflation over the medium term, but this has not prevented the central bank from cutting rates as inflation moderates. Rate-setters have cut rates at each policy meeting since July, and we expect another 25bp cut on 5 November

US Treasury yields look like they want to nudge higher when they can. And why not, as corporate earnings are firm, and hard macro data is being kept under shutdown wraps. New lows in euro rate volatility help spreads on European government bonds (EGBs) tighten further. Given the spread tightness, Bunds look increasingly attractive as a risk hedge

Affordability in the German real estate market remains strained. However, the recent surge in rents and a low homeownership ratio should still support the market

PEC+ is scheduled to meet this weekend, with the expectation that the group will agree on an output hike for December

Spain’s economy grew by 0.6% over the third quarter, following a robust second quarter, as external demand weakened. With signs of cooling in industrial activity and tourism, growth is expected to normalise over the coming quarters and into 2026

To meet surging power demand, the US needs to leverage all sources of energy with a laser focus on efficiency, reliability and affordability, not least if it's going to win the AI race too

Oil prices are trading firmer this morning after the Trump administration imposed sanctions on Russian oil producers Rosneft and Lukoila
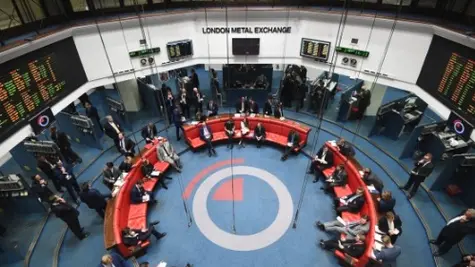
LME Week, the biggest gathering of the metals industry, brought a cautiously upbeat tone to metals markets this year. While macro uncertainty, particularly around China-US trade negotiations, continues to cloud near-term demand, participants broadly see a turning point as physical tightness and supply disruptions come into focus

Spot gold prices sold off aggressively yesterday as participants took profits in a market that has been extremely overbought

The current risks are towards more ECB easing, but because medium-term risks are tilted to the upside, we think markets will remain firmly anchored around a 1.75% landing zone. In the US, the ultra front end has a tight feel to it, while longer tenor yields have a more loose tendency. We identify some technical factors driving this

The eurozone calendar is empty until Friday’s PMI and EUR/USD moves will primarily depend on market sentiment about the US credit market. What is important to note is that EUR/USD is spot on its short-term fair value (1.167) despite the recent rally.

Chinese GDP slowed by less than expected in the third quarter amid the boost from external demand. With China on track to hit this year's growth target, we could see less policy urgency. But weak confidence translating to soft consumption, investment, and a worsening property price downturn still need to be addressed

Gold and silver hit another record high this morning, topping the all-time peak set just yesterday

Markets are quite clearly rethinking popular short-USD trades, but further gains may prove harder to sustain unless markets start to price out Fed easing. With the US CPI report reportedly being published next week, we actually see a good chance an October cut will be greenlighted. Today, keep an eye on more French news and Canada’s jobs numbers

The oil market came under some pressure this morning after reports of a potential breakthrough on the Middle East peace deal. Higher oil inventory in the US further added to the pressure on oil prices

Spot gold extended its rally to top $4,000/oz for the first time this morning, as concerns over the US economy and a government shutdown boost demand for safe havens

The oil market opened higher in the early trading session today following a modest output hike from OPEC+ for November 2025. Meanwhile, gold continued its rally to new record highs amid the prolonged US shutdown

The pickup in inflation to 2.2% in September was mainly due to energy effects, which will fade in the months ahead. A small undershooting of the inflation target actually seems realistic around the turn of the year. Expect the ECB to hold rates steady for now

The Reserve Bank of Australia holds its cash rate steady at 3.6%, in line with expectations. The cautious stance reflects concern over rising headline CPI inflation. As it stands, we think the probability of a rate cut at the November meeting has meaningfully diminished. The Aussie dollar remains supported

Following a second quarter still heavily impacted by the introduction of new US tariffs, early data for the third quarter points to a very mild improvement, though sectoral contributions remain uneven. Today’s confidence indicators for September appear to support this view

Uh oh — that US growth report yesterday was just a bit too strong for investors' liking. On the surface, strong GDP should be good news but the problem is, such strong growth doesn't support further Federal Reserve (Fed) rate cuts, and it could even boost inflation expectations on top of potential tariff-led pressures. Understandably, October rate cut expectations took a hit after the GDP release.

This is a follow-up analysis and a timely update of our prior publication, “Gold (XAU/USD) Technical: Eyeing a new all-time high above US$3,675, supported by positive flows and positioning”, published on 15 September 2025.

Henry hub natural gas extended declines yesterday after the US reported above-average natural gas inventory injections over the last week. Total gas stockpiles remain above the five-year average, weighing on sentiment

August US nominal retail sales rose more strongly than anticipated, but volume growth remains range-bound with consumers wary of potential tariff-induced price hikes and broadening evidence of a cooling jobs market

Gold continues to rally to fresh record highs amid growing expectations that the US Fed will cut rates this week. Here's what's happening in the commodity space

The week kicks off on a slightly positive note after last week's softer-than-expected US inflation data paved the way for a rate cut on Wednesday. Combined with signs of a rapidly deteriorating US jobs market, investors now expect the Federal Reserve (Fed) to begin a series of cuts this week.

The week started slowly in the US and Canada as markets were closed for the Labour Day holiday.

Unlike financial markets, we still think the odds are tilted slightly in favour of another Bank of England rate cut in November. Nothing is guaranteed, though, and these are the key data points that will decide the fate of the Bank's easing cycle later this year

The number of unemployed people has increased above the three-million mark for the first time since 2015, providing further evidence that a long period of economic stagnation eventually takes a toll on the labour market

Hungary's recent labour market data shows a seasonal improvement, resulting in a record-high employment rate. The situation for employers is growing hotter as wage expectations remain high, but the economy struggles to thrive

The recent price actions of Gold (XAU/USD) have started to trade firmer since last Friday, 22 August, with a gain of 1%, on increased hopes that the US Federal Reserve is likely to enact its first interest rate cut of 2025 in the next month's FOMC meeting.

Oil prices dropped by over 1% after they had risen by almost 2% on Monday to start the week on the front foot. Traders are watching the war in Ukraine and the possibility of interruptions to Russia's oil supply.
Brent crude oil fell by $1.08, or 1.57%, to $67.72 per barrel. It had reached its highest price since early August just a day earlier. West Texas Intermediate (WTI) crude oil also dropped, losing $1.13, or about 1.74%, to $63.67.

Although real wage growth was strong in June, it has not yet returned to the double-digit levels seen in previous years. We expect negative perceptions of household finances to persist. Weak consumer confidence continues to be a problem for the economy

Hopes for a swift resolution to the Russia-Ukraine conflict have proven vain. Discussions between Donald Trump, Vladimir Putin, and Volodymyr Zelenskyy yielded no breakthrough, with market expectations for a 2025 ceasefire dropping from around 40% to below 25%.

The New Zealand dollar has steadied on Monday. In the European session, NZD/USD is trading at 0.562, down 0.07% on the day. On Friday, the New Zealand dollar shot up 0.82%, its best one-day performance since June.
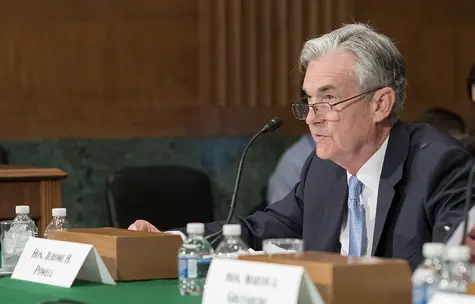
Investors lapped up Jerome Powell's words like honey on Friday, as the man has apparently been troubled enough by the latest weakness in jobs numbers to say that this situation "suggests that downside risks to employment are rising" and that "if those risks materialize, they can do so quickly in the form of sharply higher layoffs and rising unemployment." And no one wants that to happen – especially after heavy criticism from the White House pointing at Powell as Mr. Too Late.

Oil prices are set to finish this week higher as hopes for an imminent ceasefire between Russia and Ukraine fade

Gold prices have rallied from an overnight low around the $3323/oz handle to a high of $3360/oz before settling around the $3350/oz mark.The precious metal looks set to continue its choppy price action at the start of a busy week.
The recovery in Gold from the overnight low could in part be down to lower US Treasury Yields with the benchmark 10Y US Treasury yield falling from its recent highs.

Oil prices are lower this morning following Trump-Zelensky talks, with focus now turning to a possible meeting between the Ukrainian leader and Russian President Putin

Oil opened lower this morning amid reduced concerns over tougher sanctions against Russia following the Trump-Putin summita

The great-and-the-good of the American central banking world are off to the Fed’s annual Jackson Hole conference. And for Chair Jerome Powell, his appearance could hardly come at a more challenging moment. James Smith looks at the key questions facing the embattled Fed boss as financial markets brace for another fiery week to come

Oil prices came under pressure yesterday after bearish supply/demand forecasts for the market. There’s also plenty of uncertainty heading into Friday’s Trump-Putin summit

This is a follow-up analysis and update of our prior report, Chart of the day – Potential bullish acceleration for Silver (XAG/USD) published on 18 June 2025.
Silver (XAG/USD) has staged the expected rally of 7.1% from 18 June 2025 to hit the predefined resistance of US$39.08 (printed a 14-year high of US$39.53 on 23 July) before it staged a corrective decline of -8.39% to hit an intraday low of US$36.21 on 31 July 2025.

Despite some short-term supportive factors for the market, oil prices continue to edge lower ahead of Friday’s Trump-Putin meeting

The energy commodity hasn't had its best performance this year. Oil got caught in the mix of many geopolitical headwinds between large supply from OPEC+ for internal reorganization (they want to force out some producing countries of the organization), Russia flooding the Market to pay for its war, downward revised global outlooks and tensions in the Middle East.

Norway’s central bank surprised with a cut in June. However, we are much more confident that it will keep rates on hold at this week’s meeting, following a rebound in inflation and a significant weakening of the krone. We believe EUR/NOK is approaching an inflection point and anticipate NOK strengthening into year-end

The geopolitical risk premium in the oil market has faded, taking a back seat after a four-week, 30% parabolic rally in West Texas Oil CFD (a proxy for WTI crude futures) during the initial phase of the Israel-Iran conflict.

Oil prices settled lower yesterday amid growing hopes that Presidents Trump and Putin will meet to discuss a Russia-Ukraine peace deal

Oil prices have not reacted to President Trump slapping an additional 25% tariff on India over its purchases of Russian oil, possibly believing there's still room for negotiation

We're changing our call on the Fed. The pressure to cut rates is intensifying as the US jobs market and the growth story are no longer looking quite so solid. While prices will rise due to tariffs, we don't see long-term inflationary pressures and believe the Fed may well start cutting rates from next month

We are upgrading W to Buy. We had downgraded to Neutral after initial tariff announcements and missed real upside, but still upgrade to Buy as the tariff macro has been less of an impact than expected, execution has continued (we never doubted this), and Wayfair has demonstrated that it’s very well positioned to capture share amidst market disruption.

Oil prices are trading weaker this morning after OPEC+ agreed on another large supply hike for September

Oil prices strengthened further after President Trump threatened penalties on India for importing Russian energy. Meanwhile, Comex copper prices plunged after the US provided new details about its 50% import tariffs, which for now only apply to semi-finished copper products

Comex copper plunged by more than 19% in minutes after President Trump excluded refined metal from his planned import tariff. The 19% fall on Wednesday was the largest intraday fall on record. Prices later pared some of the losses

The Commodities Feed: Oil rallies as Trump confirms new deadline for Russia. Oil prices extended their rally yesterday as President Trump confirmed that he will give Russia 10 days to reach a truce with Ukraine

Oil prices rallied after President Trump said he would shorten the deadline for Russia to come to a deal with Ukraine to end the war, raising supply concerns

US tariffs have had a serious adverse effect on overall South Korean exports, an examination of data indicates. Goods subject to sectoral tariffs showed notable declines. In addition, the heavy reliance on exports to both the US and China further complicates challenges for Korean exporters going forward

Japanese government efforts to moderate inflation are working, though underlying Tokyo price pressures remain elevated. Even so, the Bank of Japan is expected to stand pat next week. Its quarterly outlook report will be closely watched

Oil prices edged higher yesterday amid optimism over trade talks. This optimism is offsetting expectations of supply increases from Venezuela


Oil prices edged lower yesterday as tariff concerns linger with the 1 August deadline fast approaching

Oil prices showed little reaction to the EU’s latest sanction package against Russia. However, it could lead to further tightening in the European middle distillates market

This Sunday's Upper House elections in Japan are weighing on Japan's government bonds and the yen. Fears of political uncertainty, looser fiscal policy and also the effects of earlier BoJ policy normalisation have all contributed to JGB weakness. Here, we look at what's at stake and how markets might react

Oil prices edged lower yesterday, with a stronger US dollar providing headwinds for the market

External demand continues to support Chinese economic growth, as the first-half trade surplus surged to a new high of $586bn amid resilient export growth and a year-on-year contraction of imports. While tariffs continue to drag on exports to the US, June data showed a smaller contraction after the tariff de-escalation in May

The week starts with renewed pressure on oil prices as OPEC decided to ramp up its production restoration plans by announcing an additional 548,000 barrels per day—well above the 411,000-increase expected. Members also said they will do the same at their September meeting. Hence, the 2.2mbpd restriction that was put in place in 2023 will be fully restored a year earlier than initially planned.

FX markets are preparing for a noisy week on trade. Wednesday's expiry of the 90-day tariff deadlines will once again see some high tariff levels thrown around. This has the potential to upset the benign volatility conditions seen over the last two months, although the fallout should be nowhere near the levels seen in April. The dollar can probably stay soft

The just-released minutes of the European Central Bank's June meeting show that most ECB members were concerned about a possible inflation undershoot. Important to stress 'most', but certainly not all

South Korean inflation rises due to base effect, keeping BoK rates on hold next week. South Korean inflation rose in June, but remains within the Bank of Korea’s target range. We expect the BoK to leave rates unchanged until housing prices and increases in household debt stabilize

Eurozone PMI stagnates, with Middle East conflict adding to downside risk. The eurozone composite PMI came in at 50.2 in June – similar to May – indicating a stagnating economy after a robust first quarter. Concerns about escalation in the Middle East add a new downside risk to the growth outlook

Energy markets continue to monitor escalating Israel-Iran conflict, focusing on any signs that Iran may seek to disrupt crude flows across the Strait of Hormuz


Headlines were busy over the weekend as hostilities between Iran and Israel continued. An Iranian gas field in the Persian Gulf was hit on Saturday, fueling concerns that the escalation could spill over into global energy markets. While the damage appears limited to Iran's domestic supply, the targeted gas processing facilities are linked to offshore oil production sites, potentially threatening broader energy flows.


A further escalation in Iranian-Israeli tensions could take oil prices above $80 and would mean more upside for the dollar. The Federal Reserve was already likely to keep rates on hold through the third quarter and the latest developments only reinforce that.

Renewable natural gas is set to be in more demand in the coming years to help reduce emissions and diversify energy supply chains. Supported by policy and customer willingness to pay, the market is expected to nearly triple in Europe and more than double in the US by 2030. Despite this growth, challenges remain around policy streamlining and innovation

Markets are pricing in risks of tariffs with diverging movements across regions and asset classes.
Tariffs risks saw US and Asian equities retreat while European equities outperformed.
However, most G10 currencies outperformed the USD. Commodity- linked currencies like the CAD, AUD and NOK performed best.

• Gold prices rallied just shy of 10% in March, surpassing USD 3,100/oz to extend the year-to-date gains to 19% (after rising 27% in 2024).
• A surge in investment demand is behind the latest moves, with comments by US President Donald Trump and Elon Musk, as well as weak US consumer survey data, amplifying market fears as we approach the 2 April tariff announcements. The acceleration of ETF buying marks a sharp reversal from the outflows of this time last year.

The Nasdaq and the S&P 500 ended higher, while the dollar strengthened as cooler-than-expected inflation data calmed tariff concerns. Meanwhile, Treasury yields gained on potential inflationary impact of global trade war. Oil prices jumped on lower-than- expected oil and fuel inventories in the U.S. Safe-haven gold rose.

Calendar 2025 Henry Hub prices have rallied 38% year-to-date, taking Summer 2025 NYMEX gas above $4.70/mmBtu today (March 10th).