 Did Not Fall And It Kept The Uptrend")


M5 chart of GBP/USD
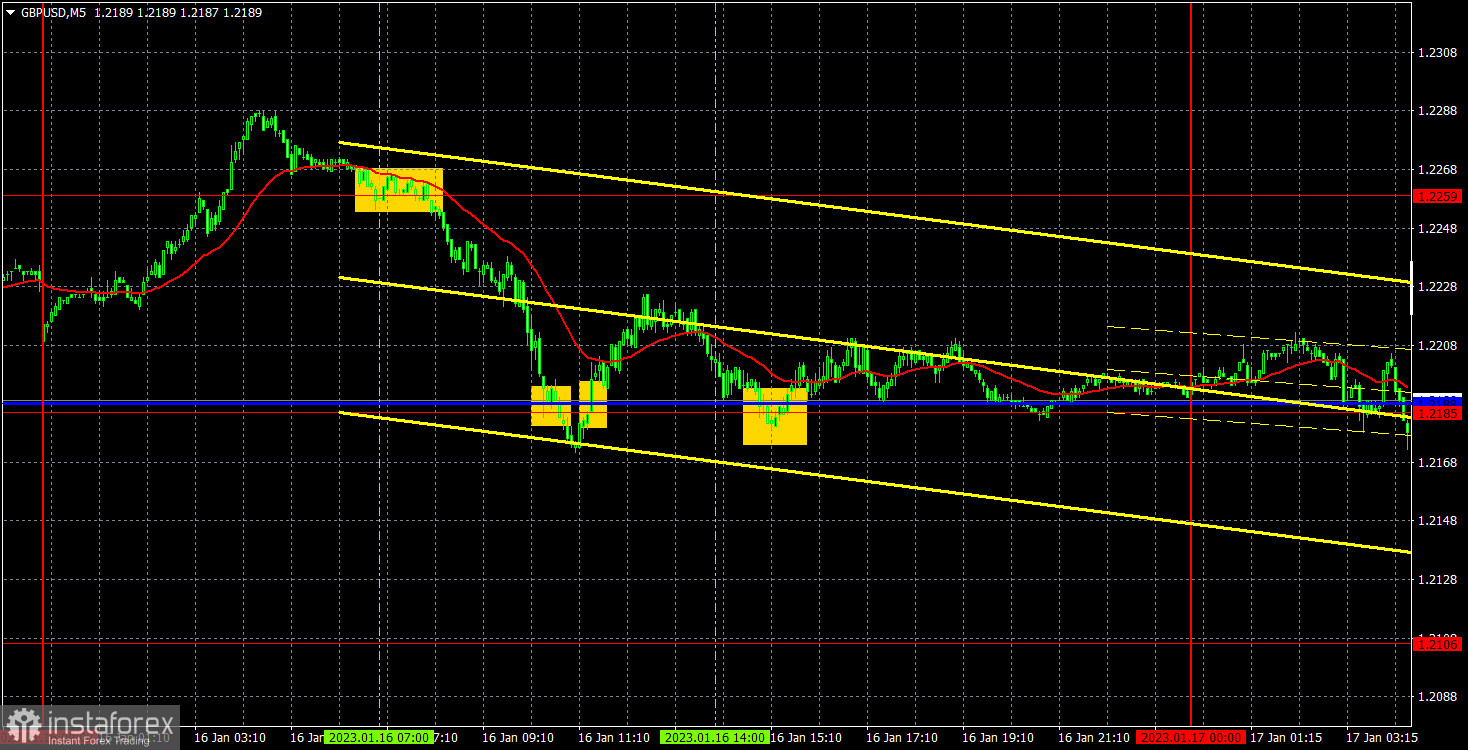
GBP/USD was also trading sideways for most of the day. The most active movements happened during the Asian trading session and the beginning of the European session, and we saw a flat during the day. Not surprising because this often happens on a Monday, which is when there is no news and reports and traders are just bracing for the week. The pound did not fall below the critical line during the day, so it kept the uptrend. If new bullish factors for the pound appear this week, then the upward movement will continue. Federal Reserve officials might change their stance to a more dovish one, which may be the reason for the dollar's fall. But this is just a guess. Recall that technical signals have higher priority and you should pay attention to them first. Much will also depend on the Bank of England's actions at the next meeting because there are active rumors about a possible slowdown of monetary tightening in February. If that happens, the pound might enter a bearish correction against the dollar.
Speaking of trading signals, everything was pretty good. There was a sell signal around 1.2259 at the beginning of the European session, afterwards the pair fell to 1.2185 and crossed this level. It failed to fall further and ended up rising above this mark, where short positions should have closed with about 50 pips of profit. A position should have been opened by the buy signal at 1.2185, but the price was able to go only 30 pips in the right direction. Therefore, the long closed at Stop Loss at breakeven. There was also another buy signal near 1.2185, but it too did not bring any profit.
COT report
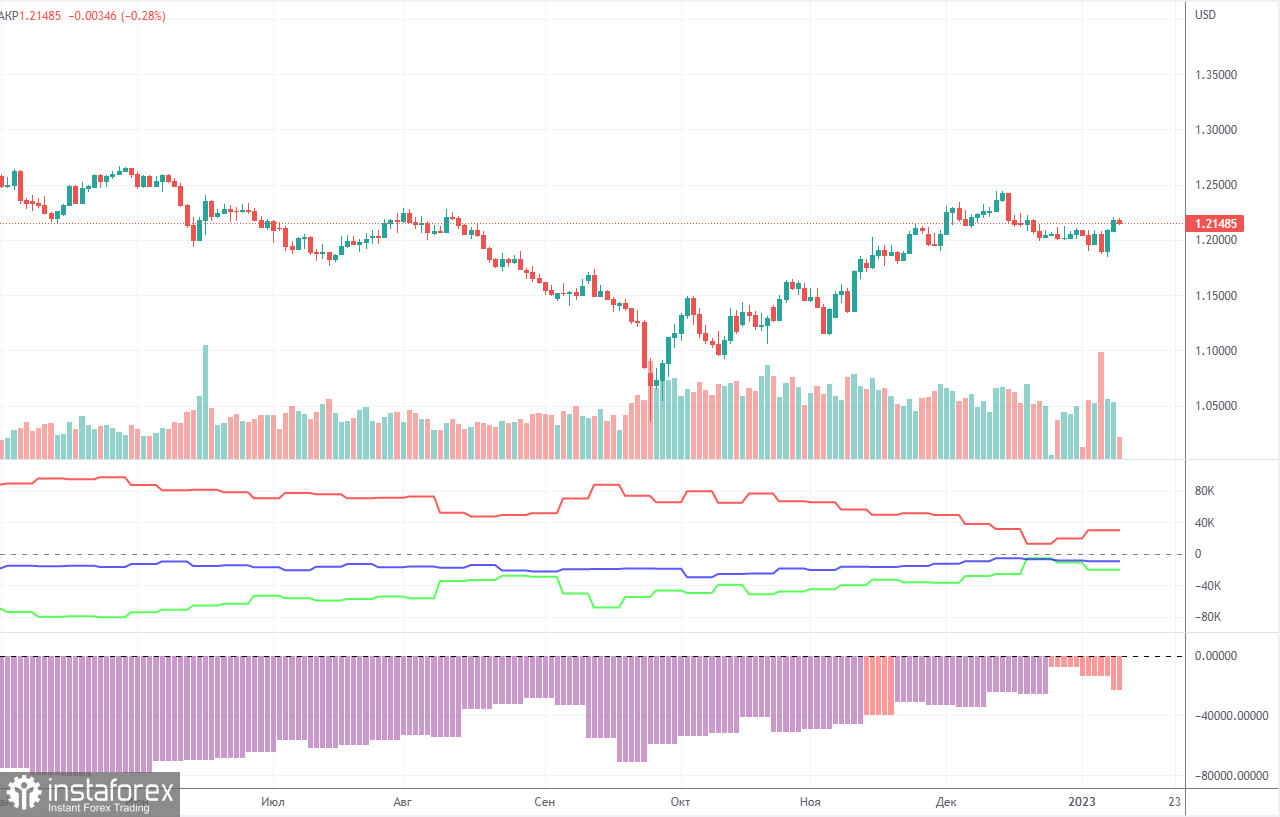
The latest COT report showed an increase in bearish sentiment. During the given period, non-commercial traders closed 7,600 long positions and opened as many as 1,500 short positions. Thus, the net position fell by about 9,100. This figure has been on the rise for several months, and the sentiment may become bullish in the near future, but it hasn't yet. Although the pound has grown against the dollar for the last few months, from a fundamental perspective, it is difficult to answer why it keeps rising. On the other hand, it could fall in the near future (in the mid-term prospect) because it still needs a correction. In general, in recent months the COT reports correspond to the pound's movements so there shouldn't be any questions. Since the net position is not even bullish yet, traders may continue to buy the pair over the next few months. Non-commercial traders now hold 36,000 long positions and 65,500 short ones. I remain skeptical about the pound's long term growth, though there are technical reasons for it. At the same time, fundamental and geopolitical factors signal that the currency is unlikely to strengthen significantly.
H1 chart of GBP/USD
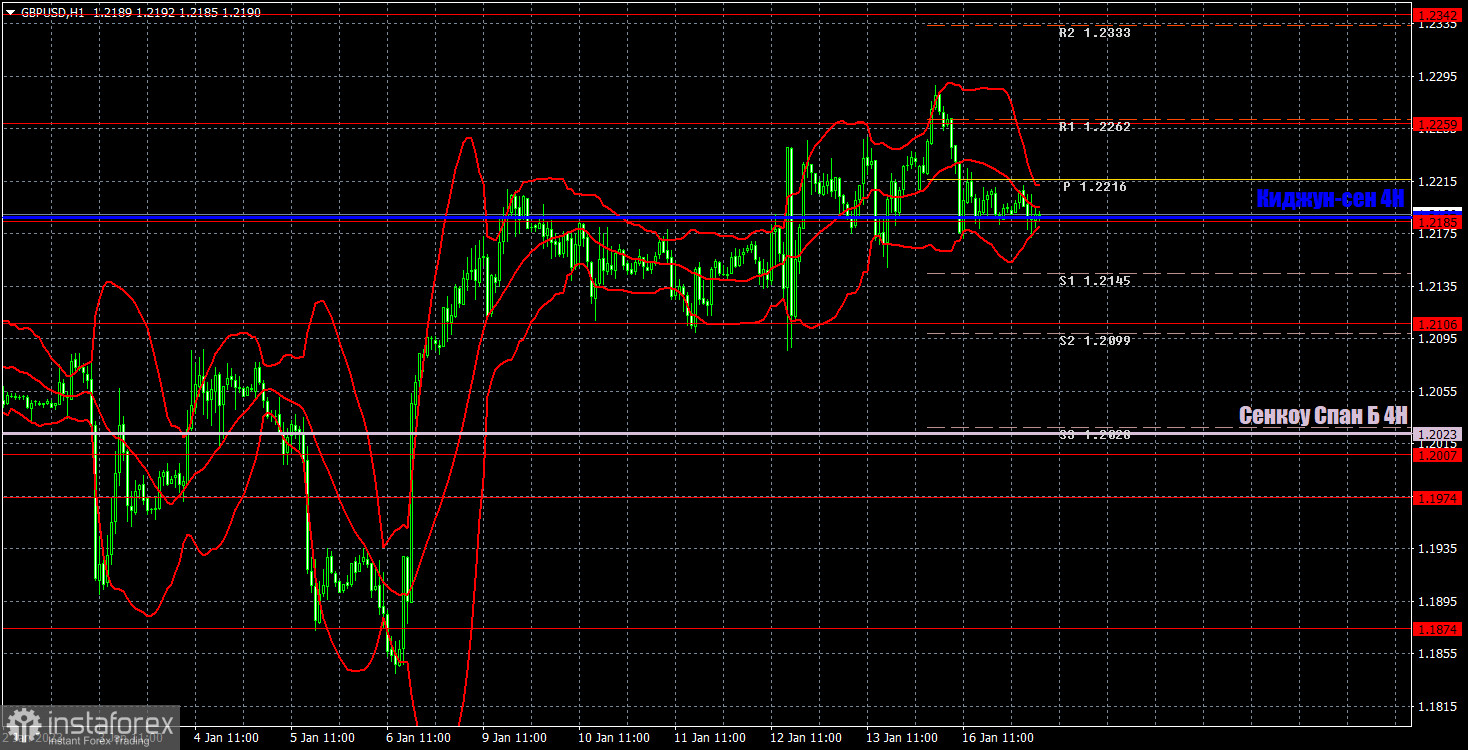
On the one-hour chart, GBP/USD continues to grow, located above the lines of the Ichimoku indicator. At this time it would be possible to form a trend line or a channel, but they would have too strong slope angle, so we believe that it is better to orient on the lines of Kijun-sen and Senkou Span B. On January 17, the pair may trade at the following levels: 1.1974-1.2007, 1.2106, 1.2185, 1.2259, 1.2342, 1.2429-1.2458, 1.2589. The Senkou Span B (1.2023) and Kijun Sen (1.2187) lines may also generate signals. Pullbacks and breakouts through these lines may produce signals as well. A Stop Loss order should be set at the breakeven point after the price passes 20 pips in the right direction. Ichimoku indicator lines may move during the day, which should be taken into account when determining trading signals. In addition, the chart does illustrate support and resistance levels, which could be used to lock in profits. On Tuesday the UK will release unemployment and payrolls data, which the market can easily ignore. There is nothing interesting in the US except a speech by Fed member John Williams later in the evening.
What we see on the trading charts:
Price levels of support and resistance are thick red lines, near which the movement may end. They do not provide trading signals.
The Kijun-sen and Senkou Span B lines are the lines of the Ichimoku indicator, moved to the one-hour chart from the 4-hour one. They are strong lines.
Extreme levels are thin red lines from which the price bounced earlier. They provide trading signals.
Yellow lines are trend lines, trend channels, and any other technical patterns.
Indicator 1 on the COT charts reflects the net position size of each category of traders.
Indicator 2 on the COT charts reflects the net position size for the non-commercial group
Relevance up to 05:00 2023-01-18 UTC+1 Company does not offer investment advice and the analysis performed does not guarantee results. The market analysis posted here is meant to increase your awareness, but not to give instructions to make a trade.
 Did Not Fall And It Kept The Uptrend")


![Turbulent Q2'23 Results for [Company Name]: Strong Exports Offset Domestic Challenges](https://www.fxmag.com/media/cache/main_box_filter/uploads/articles/2022-FXMAG-COM/GPWA/gpw-s-analytical-coverage-support-programme-wse-2-6311cd4191809-2022-09-02-11-30-41-63175bda84812-2022-09-06-16-40-26.png "Warsaw Stock Exchange: Brand24 (B24) - 1Q23 financial results")


![Turbulent Q2'23 Results for [Company Name]: Strong Exports Offset Domestic Challenges](https://www.fxmag.com/media/cache/article_small_filter/uploads/articles/2022-FXMAG-COM/GPWA/gpw-s-analytical-coverage-support-programme-wse-2-6311cd4191809-2022-09-02-11-30-41-63175bda84812-2022-09-06-16-40-26.png "Warsaw Stock Exchange: Brand24 (B24) - 1Q23 financial results")

