


What's really going on with Australian inflation
A sharp drop in November inflation is encouraging thoughts of RBA easing by May, with more rate reductions by the end of the year. We think this is unlikely. Indeed, it is easier to make the case for further hikes.
Where we are right now
The November inflation release showed a further decline in the headline inflation rate to 4.3% YoY, a sharp drop from the 4.9% rate achieved in October and also a little lower than the consensus estimate of 4.4%. On the day, there was some weakness in the AUD as the market took the numbers as corroboration for their fairly entrenched view that the Reserve Bank of Australia has finished hiking rates and was well on the way to easing.
But we're not totally convinced. And we're going to outline why the inflation data isn't as good as it may look at first glance. In doing so, we will at least raise some doubt about the view that rates have peaked. We think they may have, but a residual upside risk still exists, which could also help support the Aussie dollar.
So, what happened in November?
We prefer to start any analysis of inflation from the perspective of the CPI index, how it's changing month-on-month, and only then what this means to the annual year-on-year inflation rate. That means that fluctuations in the price level a year ago are given a fair chance to affect the inflation rate but have little or no bearing on what the price level is doing now, and we can focus more on monthly fluctuations and their trend run-rate (in practice, the annualised 3m and 6m rates). That also gives us more of a forward look at what we may expect in the coming months.
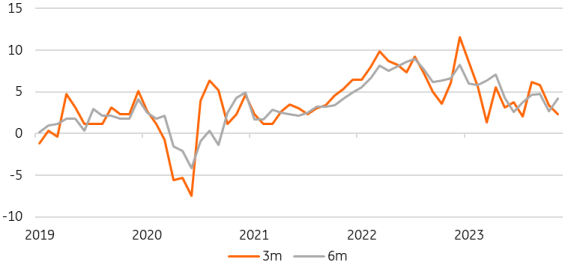
The month-on-month rate for CPI in November came in at 0.33%. If that were repeated for 12 months, it would deliver just over 4% inflation. Fortunately, the trend is not quite so high. The 3m annualised rate is only 2.3%, but this incorporates the 0.33% MoM decline in October, which will drop out of the trend once January data is available and so will probably push higher again. The 6m annualised figure, which dilutes single-month spikes and dips more than the 3m trend, is still running at 4.2% - way above the Reserve Bank of Australia's 2-3% target.
Australian annualised CPI
%, 3m and 6m


![Turbulent Q2'23 Results for [Company Name]: Strong Exports Offset Domestic Challenges](https://www.fxmag.com/media/cache/main_box_filter/uploads/articles/2022-FXMAG-COM/GPWA/gpw-s-analytical-coverage-support-programme-wse-2-6311cd4191809-2022-09-02-11-30-41-63175bda84812-2022-09-06-16-40-26.png "Warsaw Stock Exchange: Brand24 (B24) - 1Q23 financial results")


![Turbulent Q2'23 Results for [Company Name]: Strong Exports Offset Domestic Challenges](https://www.fxmag.com/media/cache/article_small_filter/uploads/articles/2022-FXMAG-COM/GPWA/gpw-s-analytical-coverage-support-programme-wse-2-6311cd4191809-2022-09-02-11-30-41-63175bda84812-2022-09-06-16-40-26.png "Warsaw Stock Exchange: Brand24 (B24) - 1Q23 financial results")

