China and Japan have been net sellers for some years now
Wednesday’s Treasury International Capital (TIC) data is more anticipated than usual. It covers April, the month that saw 'Liberation day' (2 April), and the subsequent “Pause” in the tariffs (9 April). The period was in fact dominated by a significant sell-off in Treasuries - the 10yr yield rose from a low of 3.85% to 4.6% (from 5 to 9 April). There was lots of talk of foreign selling, as part of a “Sell America” trade. These latest data will help to assess whether and to what extent Sell America was really a thing for foreign holders.
First, some context. China and Japan have been the biggest ongoing net sellers of Treasuries in the past number of years. The monthly data is quite volatile, so to get a flavor of what’s been happening, the chart below shows the cumulative volume of net selling in the past decade. China has liquidated almost $0.5trn over this period.
Cumulative net selling by China and Japan in the past decade
Measured as $ billions, cumulative since 2015
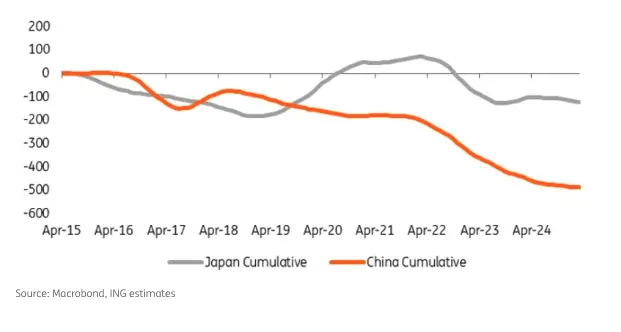
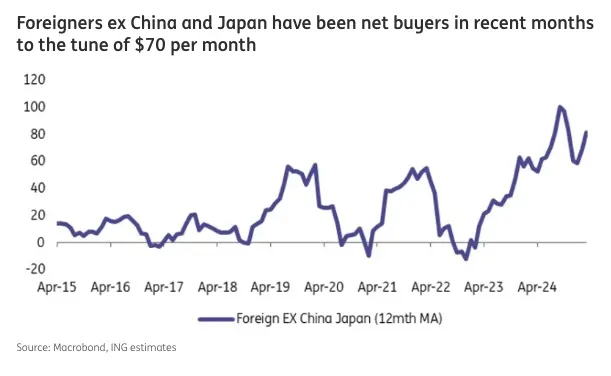
Source: Macrobond, ING estimates
But most other foreigners have in fact been decent net buyers of Treasuries
However, most other foreign holders have been net buyers. The chart below shows all other holders lumped together. They have accumulated a net $3trn over the same period.
Foreign net buying of Treasuries has dominated in the past decade
Measured in $ billions, cumulative since 2015
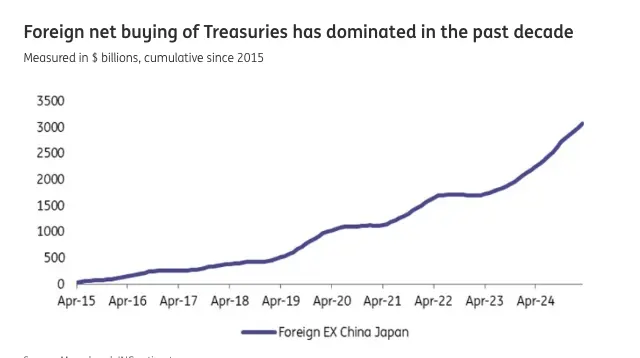
Source: Macrobond, ING estimates
The other contextual aspect to be aware of is the heavier lift being undertaken by domestic investors. While foreigners have added some $2.5trn to holdings, domestics have added almost $9trn. Hence, domestic holdings have increased to 50% of total debt, while foreign holdings have fallen to 33% (the Federal Reserve holds the rest).
Domestics have been by far the biggest buyers of Treasuries
Measured in $ billions, cumulative since 2015
Source: Macrobond, ING estimates

What to expect from the latest data, and how to interpret it
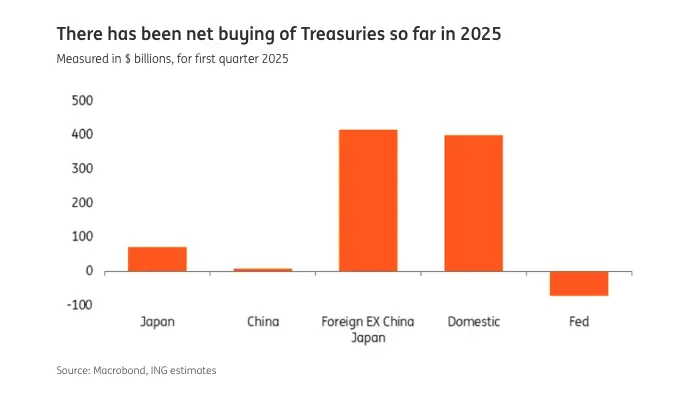
Now back to the latest readings. These data are quite volatile, so to make some sense of it we look at multi-month periods. An obvious starting point is to look at what has happened so far in 2025. In the first quarter there has been net buying across the board (with the exception of the Fed). See chart below.
There has been net buying of Treasuries so far in 2025
Measured in $ billions, for first quarter 2025
Source: Macrobond, ING estimates
A close-up of the monthly tendency for China and Japan is shown below. Presenting monthly data will make your eyes water, so these data are based off 12-month monthly averages. They have been in fact quite benign in the past number of months. Both China and Japan have been net sellers, but typically averaging less than $10bn per month.
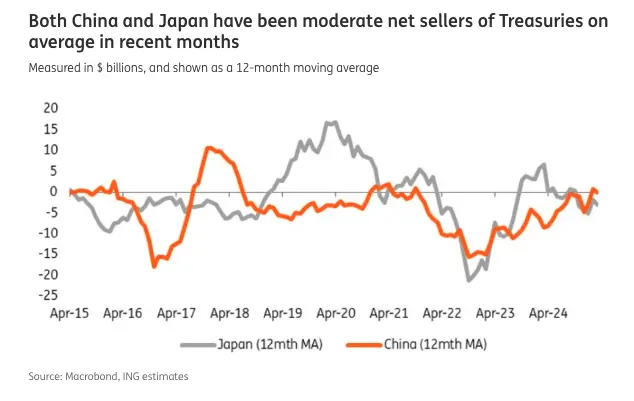
The actual data are far more volatile (hidden by the averages). For example, for March, China was a net seller of $19bn, after being a net buyer of $24bn in the previous month, and it goes on like that. We find over the past 24 months that China averaged net selling of $4bn per month, with a $15bn standard deviation around that, which means that selling of some -$20bn on any given month is within normal statistical bounds. Similar for Japan. The largest monthly net selling seen in the past 24 months was -$39bn out of Japan and -$27bn out of China. So even the realisation of a number like this would not be unprecedented.
What happens elsewhere also matters of course. The chart below shows the rolling 12-month average for foreigners excluding China and Japan. Net buying has been elevated in the past year or so, on average. But even here we’ve seen months of net selling – the biggest net selling in a month in the past couple of years was -$76bn. The average net buying in the past 24 months was $68bn (can broadly be gleaned from the chart). With a $96bn standard deviation around that, an outcome of c.-$30bn would be within the realms of normalit
And wider equities and corporate bonds (and banking flows)? Here's how we see them
While we've focussed on Treasuries above, the full TIC dataset in fact covers flows in Treasury bonds, stocks and corporate bonds. There are two headline numbers that tend to get reported. The one of most interest in markets is the “Net Long-Term TIC flows”, which covers net foreign purchases of bonds and equities. Adding on (mostly) banking flows gives “Total Net TIC Flows”. These data are highly volatile, typically without a meaningful seasonal rationale, so the graph below smooths the series out by taking a rolling 12-month average. It shows a tendency towards a rising trend in net inflows.

The March data saw a net inflow of $254bn for the Total and a net inflow of $162bn for Long-Term Securities. Those data are running above the 24-month averages of $82bn and $67bn respectively. The respective standard deviations are $126bn and $71bn, which implies that delivered outcomes as low as -$44bn and -$4bn respectively would be within the norms of the data series in the past couple of years.


