


By InvestMacro | COT | Data Tables | COT Leaders | Downloads | COT Newsletter
Here are the latest charts and statistics for the Commitment of Traders (COT) data published by the Commodities Futures Trading Commission (CFTC).
The latest COT data is updated through Tuesday January 25th and shows a quick view of how large traders (for-profit speculators and commercial entities) were positioned in the futures markets.
Highlighting the COT soft commodities data is the sharp rebound in Corn futures bets. The speculative net position in the Corn futures jumped this week by over +50,000 contracts after falling in the previous three weeks. This marked the largest one-week gain of the past twelve weeks and pushed the net bullish position back over the +400,000 contract level. Corn continues to have an extreme bullish strength score at 86.1 percent (current speculator standing compared to past three years, above 80 is bullish extreme, below 20 is bearish extreme) at the current time.
The soft commodities that saw higher bets this week were Corn (50,960 contracts), Sugar (8,115 contracts), Soybeans (20,857 contracts), Soybean Oil (16,969 contracts), Lean Hogs (9,741 contracts) and Wheat (6,821 contracts). The markets with lower bets were Soybean Meal (-1,875 contracts), Live Cattle (-14,921 contracts), Cotton (-1,339 contracts), Cocoa (406 contracts), Coffee (-2,141 contracts).
| Jan-25-2022 | OI | OI-Index | Spec-Net | Spec-Index | Com-Net | COM-Index | Smalls-Net | Smalls-Index |
|---|---|---|---|---|---|---|---|---|
| WTI Crude | 2,095,994 | 35 | 373,415 | 28 | -420,646 | 61 | 47,231 | 82 |
| Gold | 572,078 | 39 | 220,151 | 58 | -249,746 | 41 | 29,595 | 48 |
| Silver | 151,779 | 18 | 32,141 | 54 | -47,684 | 52 | 15,543 | 33 |
| Copper | 205,771 | 30 | 26,481 | 61 | -32,836 | 37 | 6,355 | 62 |
| Palladium | 9,034 | 11 | -1,988 | 10 | 2,274 | 90 | -286 | 28 |
| Platinum | 53,390 | 10 | 13,792 | 22 | -19,227 | 82 | 5,435 | 38 |
| Natural Gas | 1,141,796 | 7 | -124,535 | 41 | 97,541 | 62 | 26,994 | 47 |
| Brent | 224,561 | 59 | -25,936 | 73 | 23,862 | 29 | 2,074 | 37 |
| Heating Oil | 360,969 | 38 | 18,000 | 69 | -40,959 | 28 | 22,959 | 78 |
| Soybeans | 735,966 | 30 | 148,872 | 67 | -112,799 | 39 | -36,073 | 12 |
| Corn | 1,539,124 | 28 | 439,098 | 86 | -389,471 | 16 | -49,627 | 14 |
| Coffee | 274,327 | 40 | 61,643 | 93 | -64,950 | 9 | 3,307 | 11 |
| Sugar | 875,995 | 12 | 121,283 | 62 | -142,972 | 41 | 21,689 | 35 |
| Wheat | 390,266 | 29 | 11,661 | 57 | -3,525 | 37 | -8,136 | 63 |
CORN Futures:
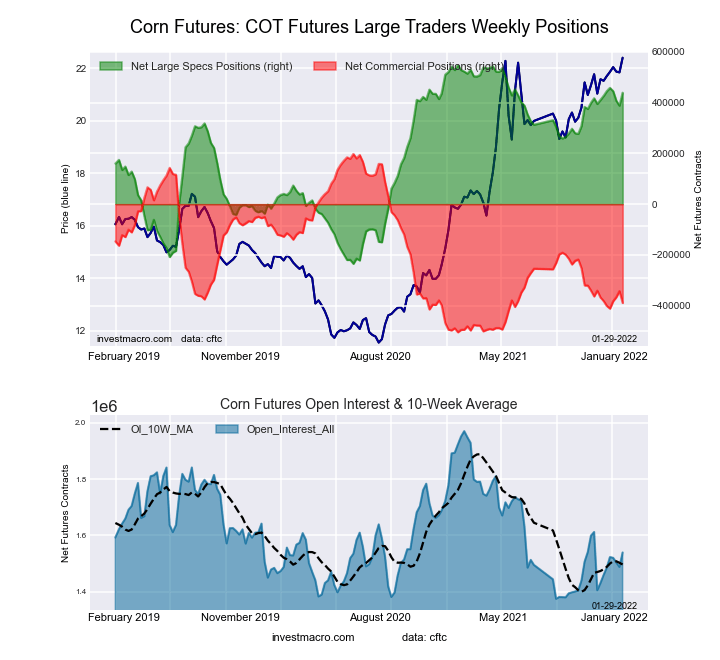 The CORN large speculator standing this week totaled a net position of 439,098 contracts in the data reported through Tuesday. This was a weekly lift of 50,960 contracts from the previous week which had a total of 388,138 net contracts.
This week’s current strength score (the trader positioning range over the past three years, measured from 0 to 100) shows the speculators are currently Bullish-Extreme with a score of 86.1 percent. The commercials are Bearish-Extreme with a score of 16.4 percent and the small traders (not shown in chart) are Bearish-Extreme with a score of 14.5 percent.
| CORN Futures Statistics | SPECULATORS | COMMERCIALS | SMALL TRADERS |
| – Percent of Open Interest Longs: | 34.1 | 44.2 | 9.0 |
| – Percent of Open Interest Shorts: | 5.6 | 69.5 | 12.2 |
| – Net Position: | 439,098 | -389,471 | -49,627 |
| – Gross Longs: | 524,903 | 680,057 | 137,937 |
| – Gross Shorts: | 85,805 | 1,069,528 | 187,564 |
| – Long to Short Ratio: | 6.1 to 1 | 0.6 to 1 | 0.7 to 1 |
| NET POSITION TREND: | |||
| – Strength Index Score (3 Year Range Pct): | 86.1 | 16.4 | 14.5 |
| – Strength Index Reading (3 Year Range): | Bullish-Extreme | Bearish-Extreme | Bearish-Extreme |
| NET POSITION MOVEMENT INDEX: | |||
| – 6-Week Change in Strength Index: | 1.6 | -1.1 | -2.8 |
SUGAR Futures:
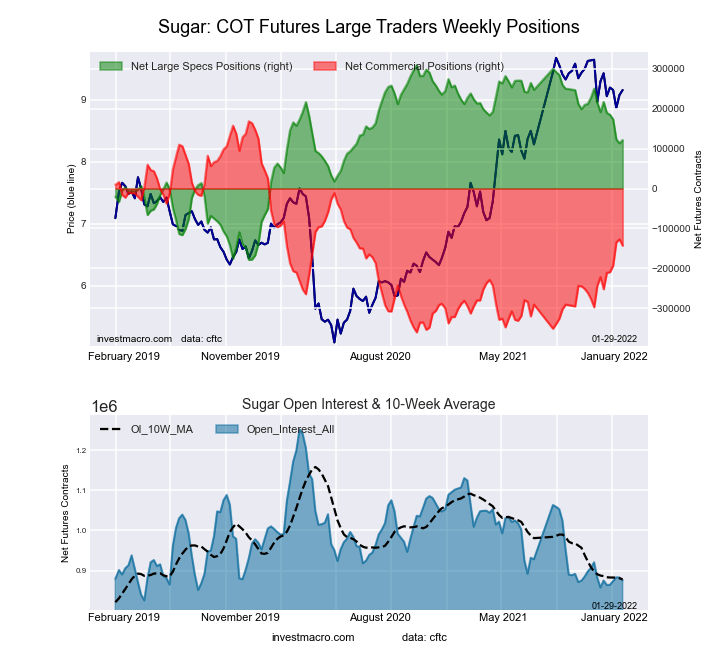 The SUGAR large speculator standing this week totaled a net position of 121,283 contracts in the data reported through Tuesday. This was a weekly lift of 8,115 contracts from the previous week which had a total of 113,168 net contracts.
This week’s current strength score (the trader positioning range over the past three years, measured from 0 to 100) shows the speculators are currently Bullish with a score of 61.5 percent. The commercials are Bearish with a score of 41.0 percent and the small traders (not shown in chart) are Bearish with a score of 34.7 percent.
| SUGAR Futures Statistics | SPECULATORS | COMMERCIALS | SMALL TRADERS |
| – Percent of Open Interest Longs: | 21.4 | 54.8 | 8.7 |
| – Percent of Open Interest Shorts: | 7.6 | 71.1 | 6.2 |
| – Net Position: | 121,283 | -142,972 | 21,689 |
| – Gross Longs: | 187,445 | 479,923 | 76,345 |
| – Gross Shorts: | 66,162 | 622,895 | 54,656 |
| – Long to Short Ratio: | 2.8 to 1 | 0.8 to 1 | 1.4 to 1 |
| NET POSITION TREND: | |||
| – Strength Index Score (3 Year Range Pct): | 61.5 | 41.0 | 34.7 |
| – Strength Index Reading (3 Year Range): | Bullish | Bearish | Bearish |
| NET POSITION MOVEMENT INDEX: | |||
| – 6-Week Change in Strength Index: | -19.6 | 20.6 | -17.0 |
COFFEE Futures:
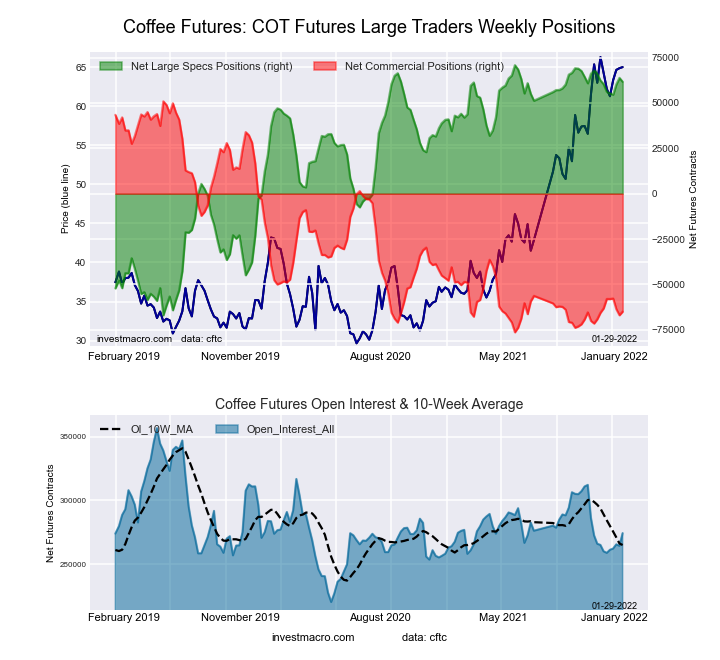 The COFFEE large speculator standing this week totaled a net position of 61,643 contracts in the data reported through Tuesday. This was a weekly decrease of -2,141 contracts from the previous week which had a total of 63,784 net contracts.
This week’s current strength score (the trader positioning range over the past three years, measured from 0 to 100) shows the speculators are currently Bullish-Extreme with a score of 93.4 percent. The commercials are Bearish-Extreme with a score of 8.9 percent and the small traders (not shown in chart) are Bearish-Extreme with a score of 11.2 percent.
| COFFEE Futures Statistics | SPECULATORS | COMMERCIALS | SMALL TRADERS |
| – Percent of Open Interest Longs: | 27.6 | 42.5 | 3.8 |
| – Percent of Open Interest Shorts: | 5.1 | 66.1 | 2.6 |
| – Net Position: | 61,643 | -64,950 | 3,307 |
| – Gross Longs: | 75,714 | 116,487 | 10,526 |
| – Gross Shorts: | 14,071 | 181,437 | 7,219 |
| – Long to Short Ratio: | 5.4 to 1 | 0.6 to 1 | 1.5 to 1 |
| NET POSITION TREND: | |||
| – Strength Index Score (3 Year Range Pct): | 93.4 | 8.9 | 11.2 |
| – Strength Index Reading (3 Year Range): | Bullish-Extreme | Bearish-Extreme | Bearish-Extreme |
| NET POSITION MOVEMENT INDEX: | |||
| – 6-Week Change in Strength Index: | 1.0 | -1.4 | 3.1 |
SOYBEANS Futures:
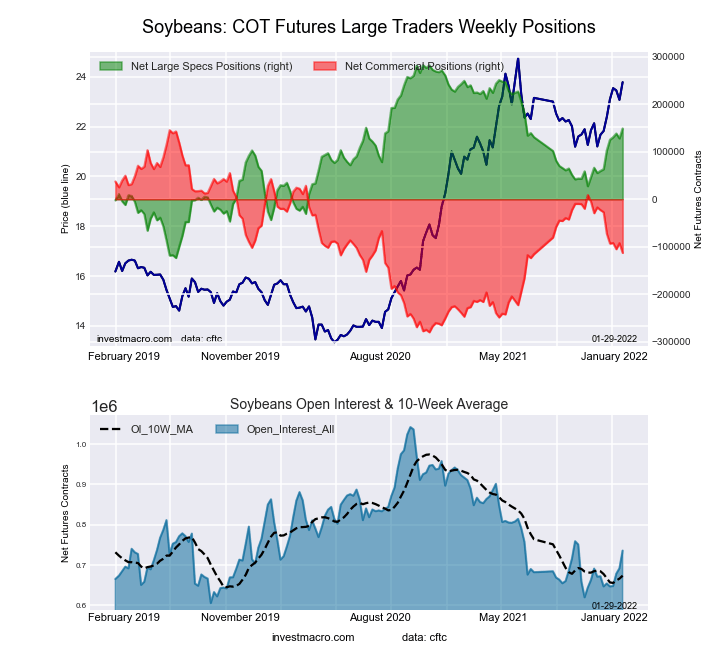 The SOYBEANS large speculator standing this week totaled a net position of 148,872 contracts in the data reported through Tuesday. This was a weekly gain of 20,857 contracts from the previous week which had a total of 128,015 net contracts.
This week’s current strength score (the trader positioning range over the past three years, measured from 0 to 100) shows the speculators are currently Bullish with a score of 67.1 percent. The commercials are Bearish with a score of 39.3 percent and the small traders (not shown in chart) are Bearish-Extreme with a score of 11.8 percent.
| SOYBEANS Futures Statistics | SPECULATORS | COMMERCIALS | SMALL TRADERS |
| – Percent of Open Interest Longs: | 26.8 | 49.9 | 6.8 |
| – Percent of Open Interest Shorts: | 6.6 | 65.2 | 11.7 |
| – Net Position: | 148,872 | -112,799 | -36,073 |
| – Gross Longs: | 197,316 | 367,156 | 49,857 |
| – Gross Shorts: | 48,444 | 479,955 | 85,930 |
| – Long to Short Ratio: | 4.1 to 1 | 0.8 to 1 | 0.6 to 1 |
| NET POSITION TREND: | |||
| – Strength Index Score (3 Year Range Pct): | 67.1 | 39.3 | 11.8 |
| – Strength Index Reading (3 Year Range): | Bullish | Bearish | Bearish-Extreme |
| NET POSITION MOVEMENT INDEX: | |||
| – 6-Week Change in Strength Index: | 21.1 | -20.1 | -0.0 |
SOYBEAN OIL Futures:
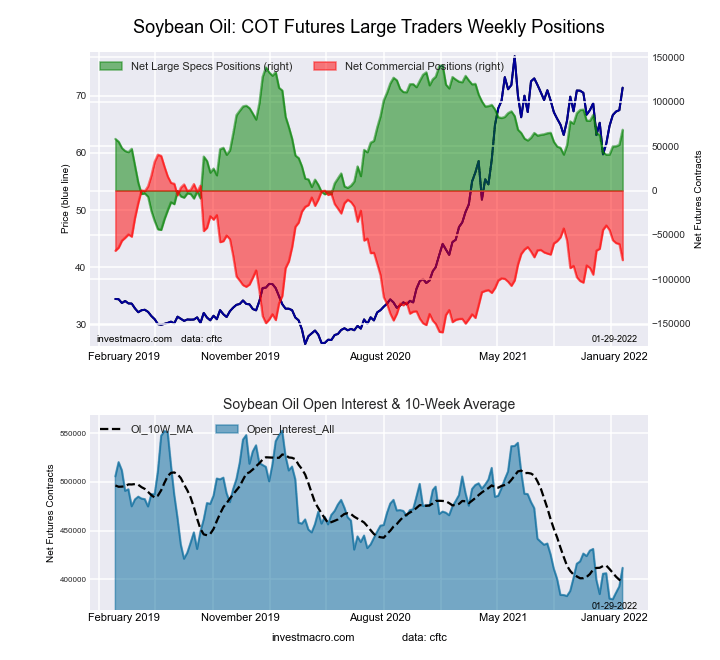 The SOYBEAN OIL large speculator standing this week totaled a net position of 68,472 contracts in the data reported through Tuesday. This was a weekly rise of 16,969 contracts from the previous week which had a total of 51,503 net contracts.
This week’s current strength score (the trader positioning range over the past three years, measured from 0 to 100) shows the speculators are currently Bullish with a score of 60.8 percent. The commercials are Bearish with a score of 40.6 percent and the small traders (not shown in chart) are Bullish with a score of 50.3 percent.
| SOYBEAN OIL Futures Statistics | SPECULATORS | COMMERCIALS | SMALL TRADERS |
| – Percent of Open Interest Longs: | 25.2 | 47.2 | 8.6 |
| – Percent of Open Interest Shorts: | 8.6 | 66.3 | 6.1 |
| – Net Position: | 68,472 | -78,358 | 9,886 |
| – Gross Longs: | 103,832 | 194,572 | 35,212 |
| – Gross Shorts: | 35,360 | 272,930 | 25,326 |
| – Long to Short Ratio: | 2.9 to 1 | 0.7 to 1 | 1.4 to 1 |
| NET POSITION TREND: | |||
| – Strength Index Score (3 Year Range Pct): | 60.8 | 40.6 | 50.3 |
| – Strength Index Reading (3 Year Range): | Bullish | Bearish | Bullish |
| NET POSITION MOVEMENT INDEX: | |||
| – 6-Week Change in Strength Index: | 13.7 | -17.0 | 32.5 |
SOYBEAN MEAL Futures:
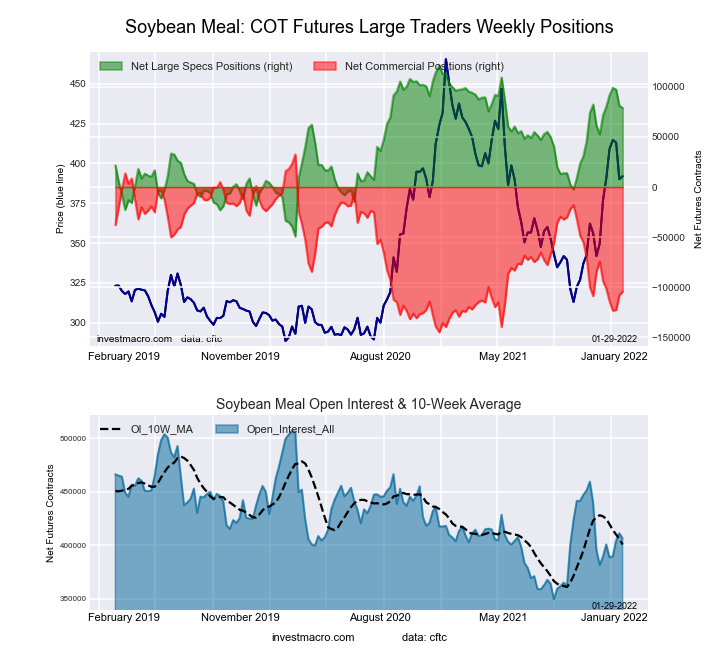 The SOYBEAN MEAL large speculator standing this week totaled a net position of 79,018 contracts in the data reported through Tuesday. This was a weekly decline of -1,875 contracts from the previous week which had a total of 80,893 net contracts.
This week’s current strength score (the trader positioning range over the past three years, measured from 0 to 100) shows the speculators are currently Bullish with a score of 75.1 percent. The commercials are Bearish with a score of 22.9 percent and the small traders (not shown in chart) are Bullish with a score of 72.4 percent.
| SOYBEAN MEAL Futures Statistics | SPECULATORS | COMMERCIALS | SMALL TRADERS |
| – Percent of Open Interest Longs: | 24.9 | 47.6 | 11.8 |
| – Percent of Open Interest Shorts: | 5.4 | 73.3 | 5.5 |
| – Net Position: | 79,018 | -104,414 | 25,396 |
| – Gross Longs: | 101,074 | 193,263 | 47,848 |
| – Gross Shorts: | 22,056 | 297,677 | 22,452 |
| – Long to Short Ratio: | 4.6 to 1 | 0.6 to 1 | 2.1 to 1 |
| NET POSITION TREND: | |||
| – Strength Index Score (3 Year Range Pct): | 75.1 | 22.9 | 72.4 |
| – Strength Index Reading (3 Year Range): | Bullish | Bearish | Bullish |
| NET POSITION MOVEMENT INDEX: | |||
| – 6-Week Change in Strength Index: | 4.4 | -5.9 | 11.9 |
LIVE CATTLE Futures:
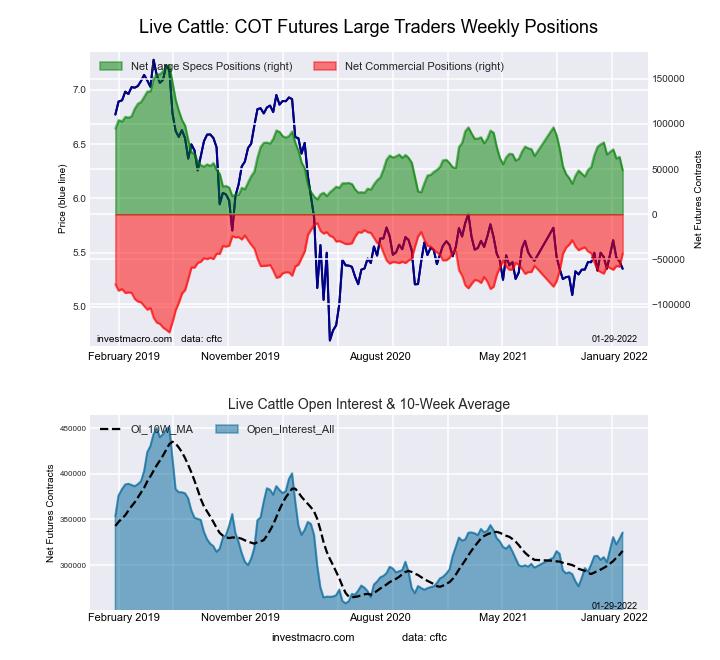 The LIVE CATTLE large speculator standing this week totaled a net position of 48,641 contracts in the data reported through Tuesday. This was a weekly decrease of -14,921 contracts from the previous week which had a total of 63,562 net contracts.
This week’s current strength score (the trader positioning range over the past three years, measured from 0 to 100) shows the speculators are currently Bearish with a score of 21.7 percent. The commercials are Bullish with a score of 72.2 percent and the small traders (not shown in chart) are Bullish with a score of 74.4 percent.
| LIVE CATTLE Futures Statistics | SPECULATORS | COMMERCIALS | SMALL TRADERS |
| – Percent of Open Interest Longs: | 32.8 | 39.3 | 10.5 |
| – Percent of Open Interest Shorts: | 18.3 | 52.2 | 12.1 |
| – Net Position: | 48,641 | -43,410 | -5,231 |
| – Gross Longs: | 110,040 | 131,826 | 35,302 |
| – Gross Shorts: | 61,399 | 175,236 | 40,533 |
| – Long to Short Ratio: | 1.8 to 1 | 0.8 to 1 | 0.9 to 1 |
| NET POSITION TREND: | |||
| – Strength Index Score (3 Year Range Pct): | 21.7 | 72.2 | 74.4 |
| – Strength Index Reading (3 Year Range): | Bearish | Bullish | Bullish |
| NET POSITION MOVEMENT INDEX: | |||
| – 6-Week Change in Strength Index: | -20.8 | 18.4 | 20.9 |
LEAN HOGS Futures:
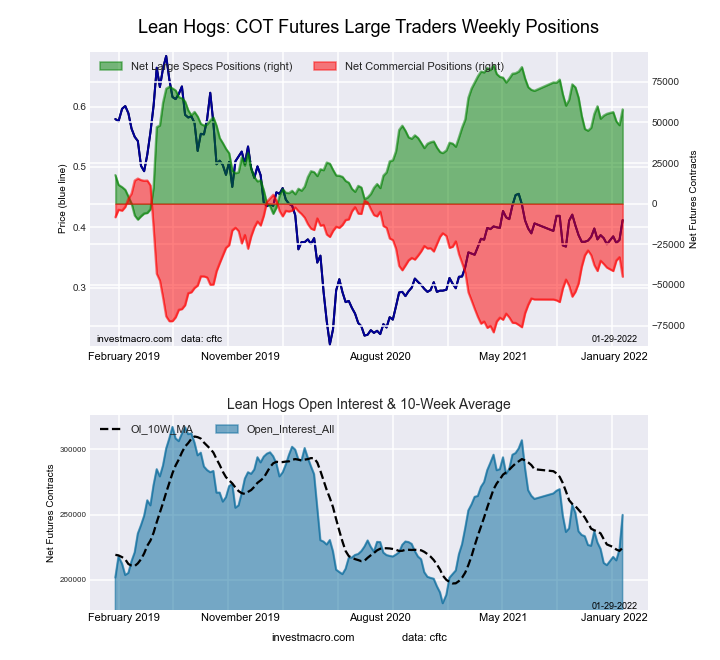 The LEAN HOGS large speculator standing this week totaled a net position of 58,046 contracts in the data reported through Tuesday. This was a weekly increase of 9,741 contracts from the previous week which had a total of 48,305 net contracts.
This week’s current strength score (the trader positioning range over the past three years, measured from 0 to 100) shows the speculators are currently Bullish with a score of 71.1 percent. The commercials are Bearish with a score of 36.2 percent and the small traders (not shown in chart) are Bearish with a score of 23.3 percent.
| LEAN HOGS Futures Statistics | SPECULATORS | COMMERCIALS | SMALL TRADERS |
| – Percent of Open Interest Longs: | 39.0 | 34.6 | 8.4 |
| – Percent of Open Interest Shorts: | 15.7 | 52.5 | 13.7 |
| – Net Position: | 58,046 | -44,897 | -13,149 |
| – Gross Longs: | 97,371 | 86,399 | 21,041 |
| – Gross Shorts: | 39,325 | 131,296 | 34,190 |
| – Long to Short Ratio: | 2.5 to 1 | 0.7 to 1 | 0.6 to 1 |
| NET POSITION TREND: | |||
| – Strength Index Score (3 Year Range Pct): | 71.1 | 36.2 | 23.3 |
| – Strength Index Reading (3 Year Range): | Bullish | Bearish | Bearish |
| NET POSITION MOVEMENT INDEX: | |||
| – 6-Week Change in Strength Index: | 4.0 | -8.3 | 17.1 |
COTTON Futures:
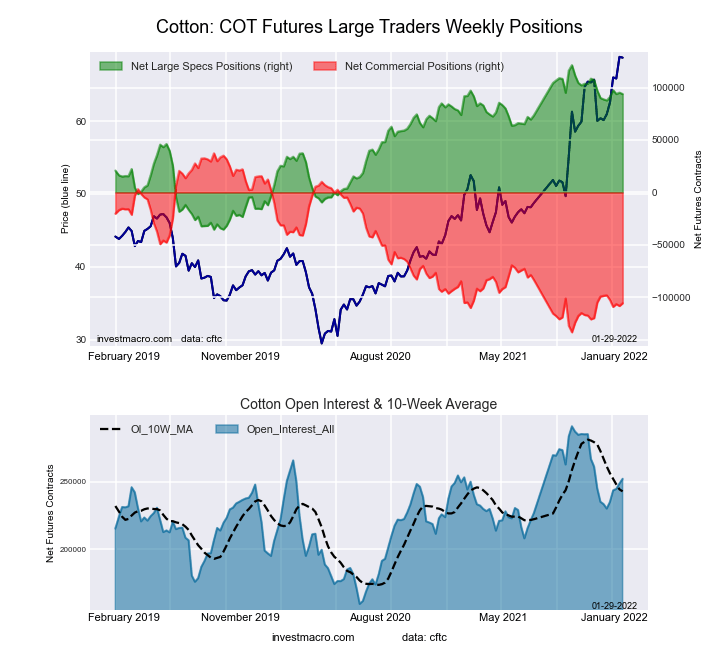 The COTTON large speculator standing this week totaled a net position of 93,787 contracts in the data reported through Tuesday. This was a weekly fall of -1,339 contracts from the previous week which had a total of 95,126 net contracts.
This week’s current strength score (the trader positioning range over the past three years, measured from 0 to 100) shows the speculators are currently Bullish-Extreme with a score of 82.4 percent. The commercials are Bearish-Extreme with a score of 16.2 percent and the small traders (not shown in chart) are Bullish-Extreme with a score of 87.5 percent.
| COTTON Futures Statistics | SPECULATORS | COMMERCIALS | SMALL TRADERS |
| – Percent of Open Interest Longs: | 43.0 | 33.8 | 7.9 |
| – Percent of Open Interest Shorts: | 5.8 | 75.7 | 3.2 |
| – Net Position: | 93,787 | -105,632 | 11,845 |
| – Gross Longs: | 108,423 | 85,060 | 19,987 |
| – Gross Shorts: | 14,636 | 190,692 | 8,142 |
| – Long to Short Ratio: | 7.4 to 1 | 0.4 to 1 | 2.5 to 1 |
| NET POSITION TREND: | |||
| – Strength Index Score (3 Year Range Pct): | 82.4 | 16.2 | 87.5 |
| – Strength Index Reading (3 Year Range): | Bullish-Extreme | Bearish-Extreme | Bullish-Extreme |
| NET POSITION MOVEMENT INDEX: | |||
| – 6-Week Change in Strength Index: | 3.3 | -4.2 | 12.4 |
COCOA Futures:
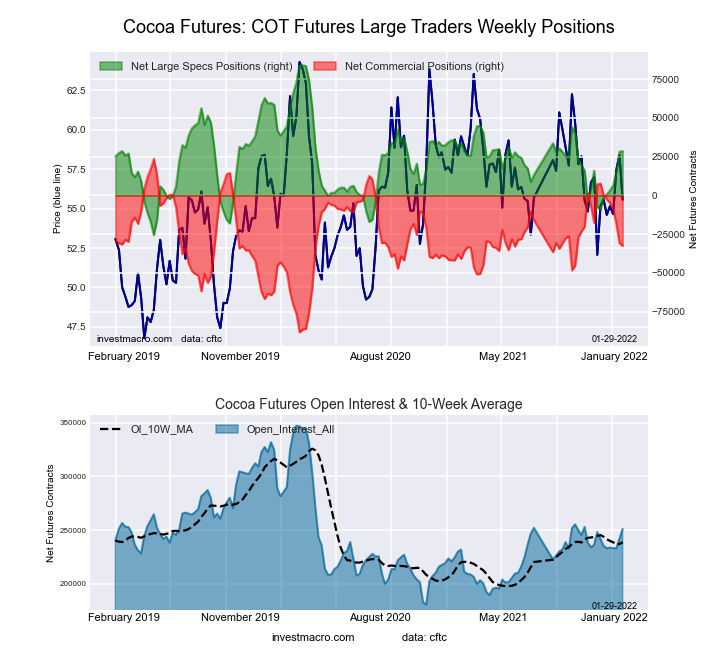 The COCOA large speculator standing this week totaled a net position of 28,620 contracts in the data reported through Tuesday. This was a weekly rise of 406 contracts from the previous week which had a total of 28,214 net contracts.
This week’s current strength score (the trader positioning range over the past three years, measured from 0 to 100) shows the speculators are currently Bearish with a score of 49.4 percent. The commercials are Bearish with a score of 49.9 percent and the small traders (not shown in chart) are Bullish with a score of 52.2 percent.
| COCOA Futures Statistics | SPECULATORS | COMMERCIALS | SMALL TRADERS |
| – Percent of Open Interest Longs: | 26.4 | 45.9 | 5.3 |
| – Percent of Open Interest Shorts: | 15.0 | 58.8 | 3.7 |
| – Net Position: | 28,620 | -32,467 | 3,847 |
| – Gross Longs: | 66,341 | 115,075 | 13,192 |
| – Gross Shorts: | 37,721 | 147,542 | 9,345 |
| – Long to Short Ratio: | 1.8 to 1 | 0.8 to 1 | 1.4 to 1 |
| NET POSITION TREND: | |||
| – Strength Index Score (3 Year Range Pct): | 49.4 | 49.9 | 52.2 |
| – Strength Index Reading (3 Year Range): | Bearish | Bearish | Bullish |
| NET POSITION MOVEMENT INDEX: | |||
| – 6-Week Change in Strength Index: | 27.1 | -29.0 | 31.8 |
WHEAT Futures:
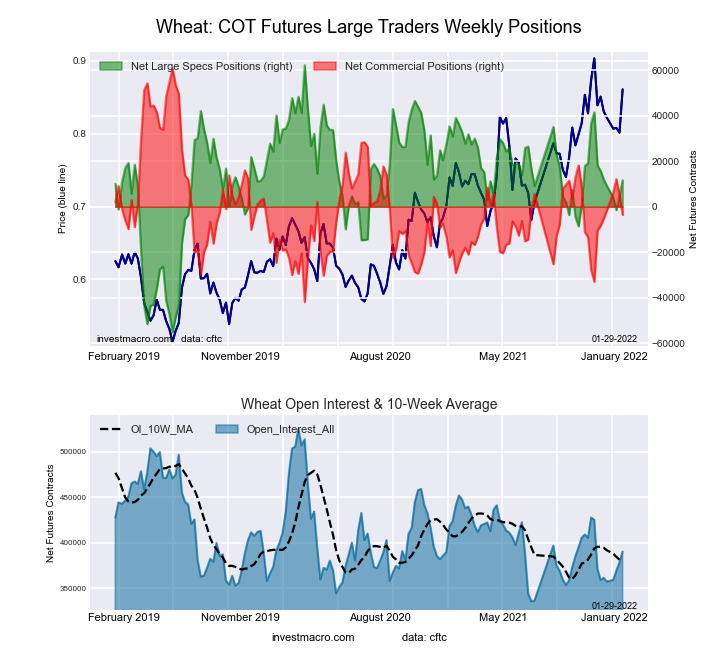 The WHEAT large speculator standing this week totaled a net position of 11,661 contracts in the data reported through Tuesday. This was a weekly boost of 6,821 contracts from the previous week which had a total of 4,840 net contracts.
This week’s current strength score (the trader positioning range over the past three years, measured from 0 to 100) shows the speculators are currently Bullish with a score of 56.9 percent. The commercials are Bearish with a score of 37.4 percent and the small traders (not shown in chart) are Bullish with a score of 62.7 percent.
| WHEAT Futures Statistics | SPECULATORS | COMMERCIALS | SMALL TRADERS |
| – Percent of Open Interest Longs: | 28.1 | 39.1 | 8.4 |
| – Percent of Open Interest Shorts: | 25.1 | 40.0 | 10.5 |
| – Net Position: | 11,661 | -3,525 | -8,136 |
| – Gross Longs: | 109,676 | 152,603 | 32,799 |
| – Gross Shorts: | 98,015 | 156,128 | 40,935 |
| – Long to Short Ratio: | 1.1 to 1 | 1.0 to 1 | 0.8 to 1 |
| NET POSITION TREND: | |||
| – Strength Index Score (3 Year Range Pct): | 56.9 | 37.4 | 62.7 |
| – Strength Index Reading (3 Year Range): | Bullish | Bearish | Bullish |
| NET POSITION MOVEMENT INDEX: | |||
| – 6-Week Change in Strength Index: | -0.3 | 1.6 | -6.3 |
Article By InvestMacro – Receive our weekly COT Reports by Email
*COT Report: The COT data, released weekly to the public each Friday, is updated through the most recent Tuesday (data is 3 days old) and shows a quick view of how large speculators or non-commercials (for-profit traders) were positioned in the futures markets.
The CFTC categorizes trader positions according to commercial hedgers (traders who use futures contracts for hedging as part of the business), non-commercials (large traders who speculate to realize trading profits) and nonreportable traders (usually small traders/speculators) as well as their open interest (contracts open in the market at time of reporting).See CFTC criteria here.


