


Relevance up to 12:00 UTC+2 Company does not offer investment advice and the analysis performed does not guarantee results. The market analysis posted here is meant to increase your awareness, but not to give instructions to make a trade.
Despite the current upside correction, the S&P 500 remains generally negative.
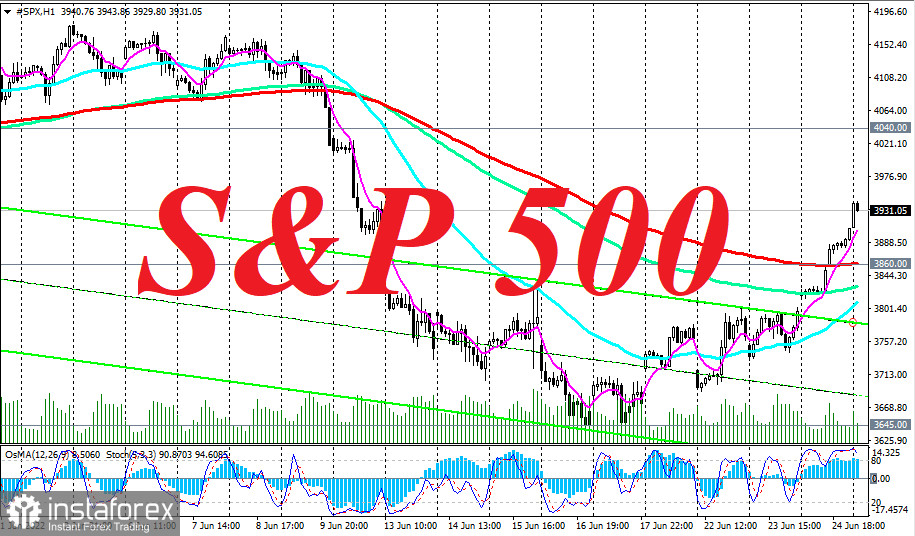
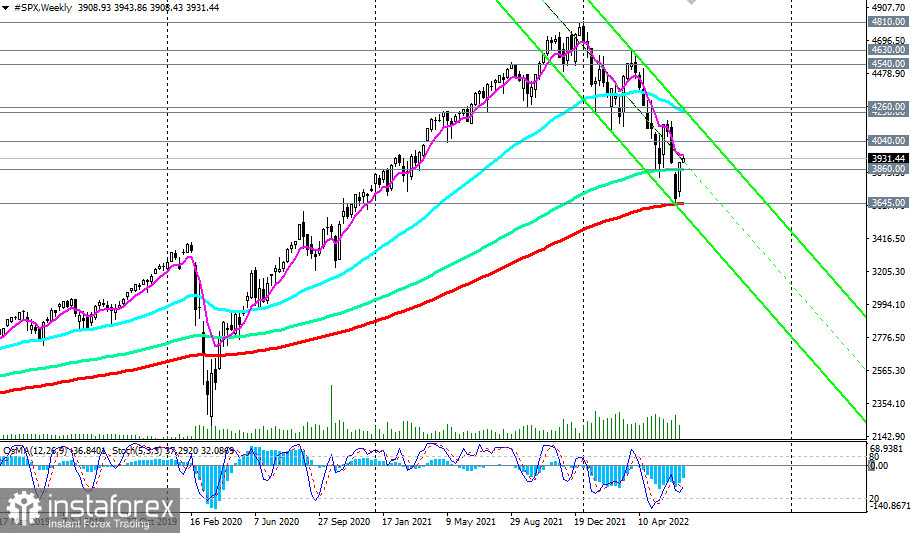
As of this writing, S&P 500 CFDs are trading near 3931.0, trying to gain a foothold in the area above the important support level of 3860.0 (200 EMA on the 1-hour chart and 144 EMA on the weekly chart).
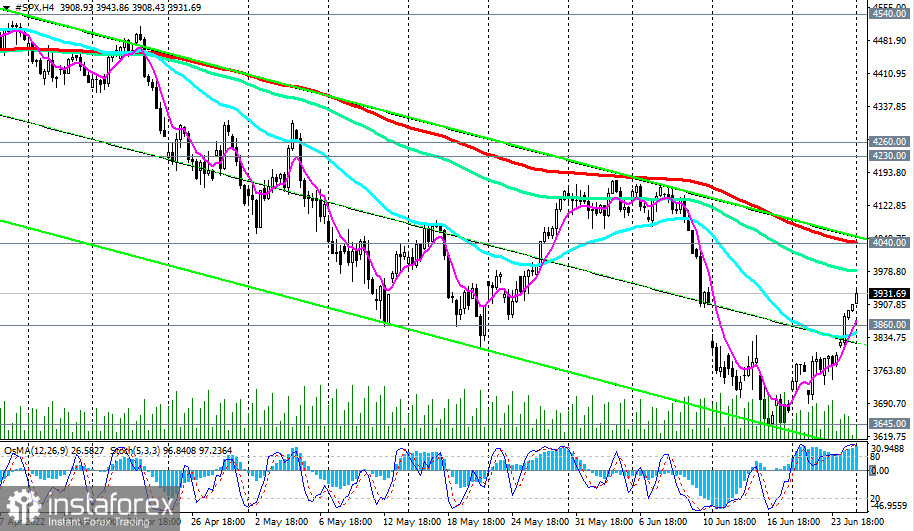
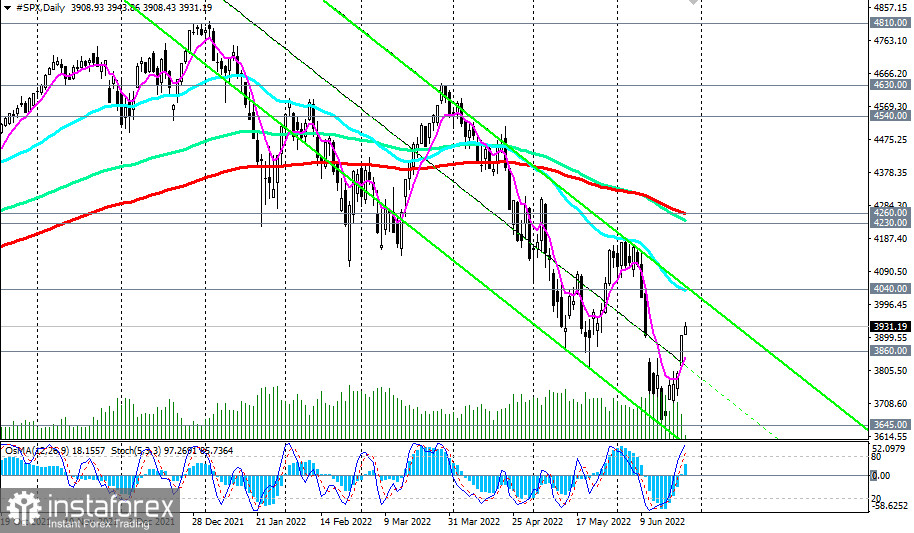
If the upward correction of the S&P 500 continues, the price may reach the important resistance level of 4040.0 (200 EMA on the 4-hour chart, 50 EMA and the upper line of the descending channel on the daily chart).
Nevertheless, investors are currently cautious on the stock market and avoiding buying risky assets.
In view of this, growth above the resistance level of 4040.0 is still unlikely. Below the key resistance level of 4260.0 (200 EMA on the daily chart), the S&P 500 remains in the bear market zone.
Therefore, a return to the area below the level of 3860.0 will be a signal for the resumption of short positions, and a breakdown of the key long-term support level of 3645.0 (200 EMA on the weekly chart) increases the risk of breaking the long-term bullish trend of the S&P 500, and, perhaps, of the entire American stock market.
In an alternative scenario, the price will break through the resistance level of 44040.0, and the S&P 500 will continue to rise. A breakdown of the resistance level 4260.0 (200 EMA on the daily chart) will bring the S&P 500 back into the long-term bull market zone.
Support levels: 3860.0, 3645.0
Resistance levels: 4040.0, 4260.0, 4540.0, 4630.0, 4800.0
Trading Tips
SellStop 3870.0. Stop-Loss 3950.0. Target 3800.0, 3700.0, 3650.0
Buy Stop 3950.0. Stop-Loss 3870.0. Target 4000.0, 4040.0, 4260.0, 4540.0, 4630.0, 4800.0


