Relevance up to 14:00 2022-06-24 UTC+2 Company does not offer investment advice and the analysis performed does not guarantee results. The market analysis posted here is meant to increase your awareness, but not to give instructions to make a trade.
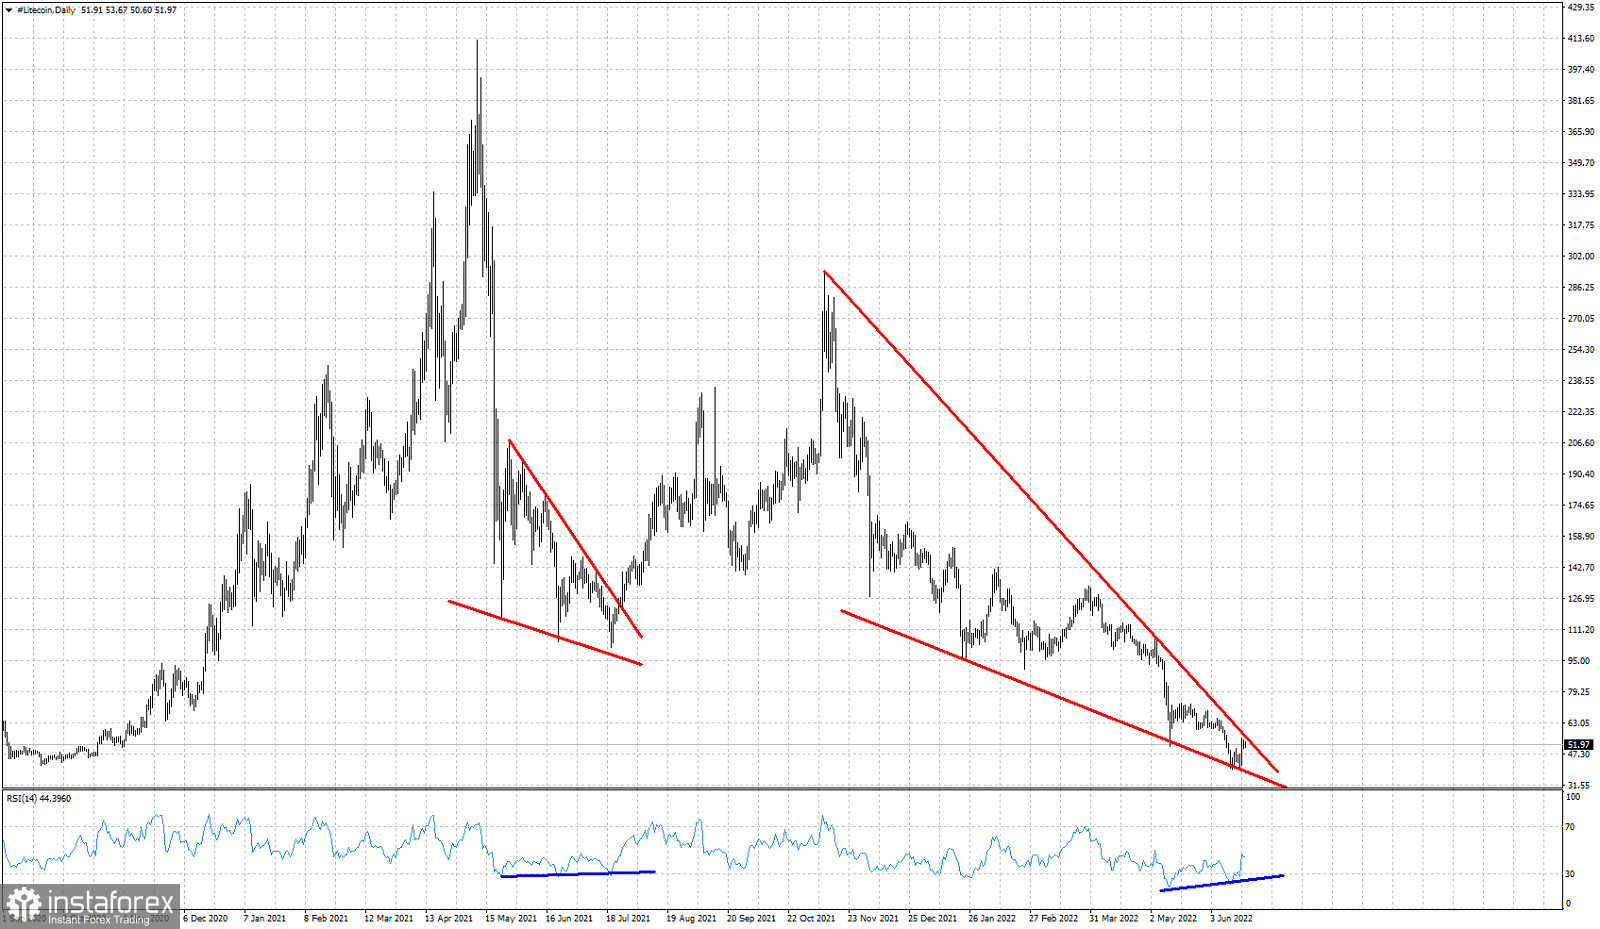
Red lines- wedge patterns
Blue lines- RSI bullish divergence
In our previous analysis we noted the downward sloping wedge pattern that has formed in the Litecoin Daily chart and its similarities to the May 2021 wedge pattern and break out. Price is now trading around $52.20 very close to the upper wedge boundary. Bulls need to break Litecoin price above $56-57 in order to call for a break out. The bullish RSI divergence supports the bullish reversal scenario. Traders need to remain patient for the break out to occur.