Relevance up to 09:00 2022-08-20 UTC+2 Company does not offer investment advice and the analysis performed does not guarantee results. The market analysis posted here is meant to increase your awareness, but not to give instructions to make a trade.
Bitcoin has been bearish since hitting the swing high of $25k. The first bearish signs came last week, but they quickly faded due to the descending triangle of intraday trading volumes and the unsuccessful retest of $25k. In addition, a row of negative fundamental factors exerted pressure on the crypto market. The US dollar index started to recover, while BTC-based crypto funds lost over $20 million last week.
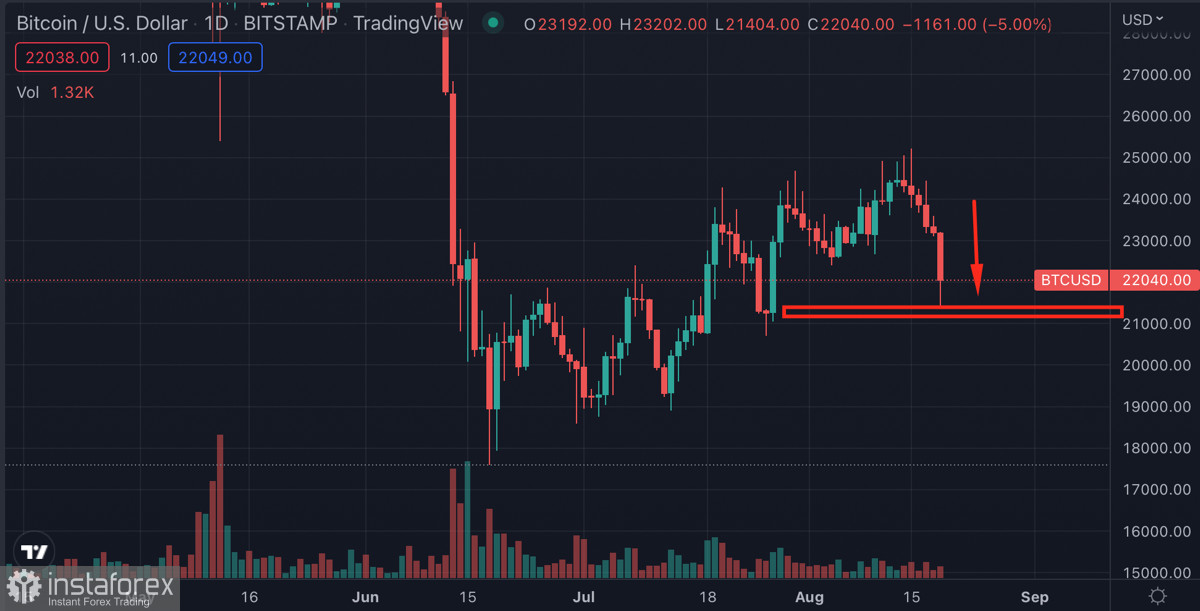
As a result, digital gold plunged, broke through $23k, and bounced to $21.2k. The steep fall came after a bearish breakout through the range of $22.8k-$23.4k. Consequently, the price tumbled to $21.4k support.


A few more fundamental and technical factors have contributed to the fall in BTC. The FOMC Minutes hinted at the continuation of rate hikes. In addition, the number of long positions grew. The volume of bullish positions has been $1 billion higher than that of bearish positions. And the market, as you know, plays against the majority.
Consequently, the market capitalization of BTC fell by 3.5% in an hour and by 5.7% in a day. The rising wedge pattern headed down, as expected. The bullish trend that emerged on July 18 stopped when the price dropped to $21,4k. Even if bulls recoup losses, the main two bearish targets are still reached: the large volume of long positions was liquidated and the uptrend line was broken.
Speaking of a possible rebound above $23k, it is highly unlikely. Technical indicators show the continuation of the bearish trend. The Stochastic Oscillator formed a bearish crossover near 60 and nosedived to the oversold level near 18. The RSI gives no signals of an impending reversal. The MACD started to move down and could enter the red zone soon. These factors reflect bearish power and the likelihood of a retest of $20k.
On the 4-hour chart, there are the first signs of a recovery. The Stochastic Oscillator shows a bullish crossover in the oversold zone. The indicator has already reached the mark of 22 and is now moving up. The RSI, however, is moving down. Thus, we have a divergence, which means that a bullish impulse is unlikely. Bitcoin has reached a point where low trading volumes make it impossible to defend major support levels. Should the current trend go on, next week would kick off with a retest of $20k.
Read more: https://www.instaforex.eu/forex_analysis/319391