


The S&P 500 index was trading 4% lower yesterday before closing 0.3% higher. So was it an upward reversal or just another temporary bottom?
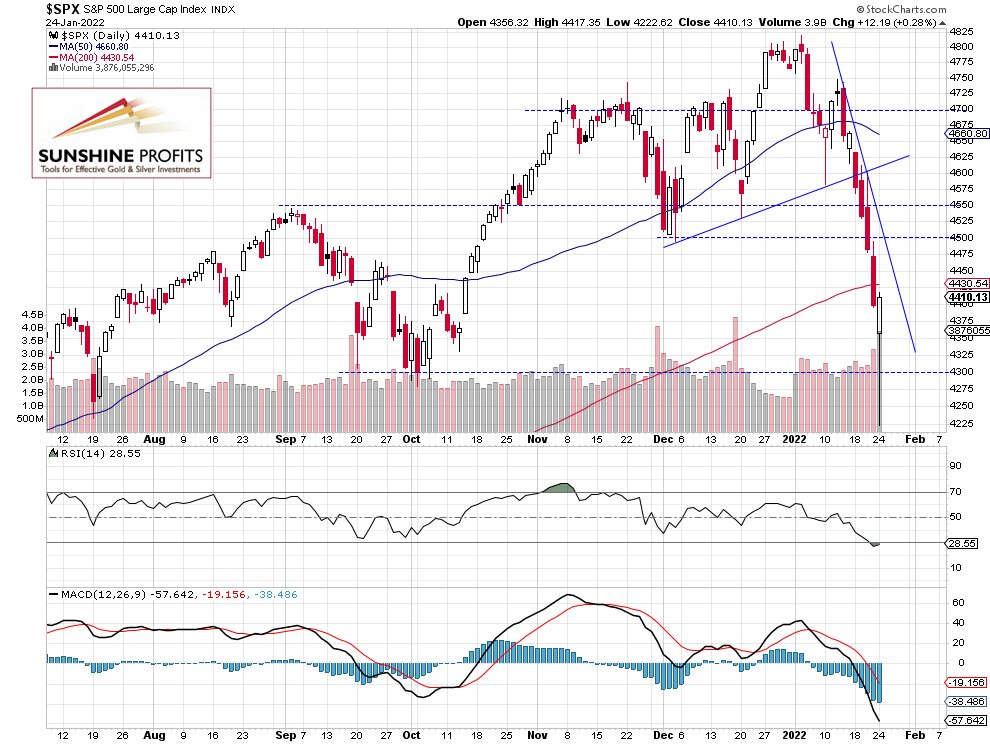
The broad stock market index accelerated its sell-off on Monday, as it reached the new local low of 4,222.62. The market was 596 points or 12.4% below the Jan. 4 record high of 4,818.62. Investors reacted to further Russia-Ukraine tensions. We are also waiting for series of quarterly earnings releases, tomorrow’s FOMC Statement release and Thursday’s important U.S. Advance GDP release. Overall, we had a big increase in volatility yesterday.
Late December – early January consolidation along the 4,800 level was a topping pattern and the index retraced all of its December’s record-breaking advance. This morning it is expected to open 1.6% lower and we may see more short-term volatility. Will it reach yesterday’s low again? Probably not – we’ll likely see a consolidation.
The nearest important resistance level is now at 4,420-4,450, marked by yesterday’s daily high, among others. On the other hand, the support level is at 4,300-4,350. The support level is also at 4,220-4,250. The S&P 500 remains below a steep short-term downward trend line, as we can see on the daily chart (chart by courtesy of http://stockcharts.com):
Microsoft Stocks Ahead of the Earnings Release
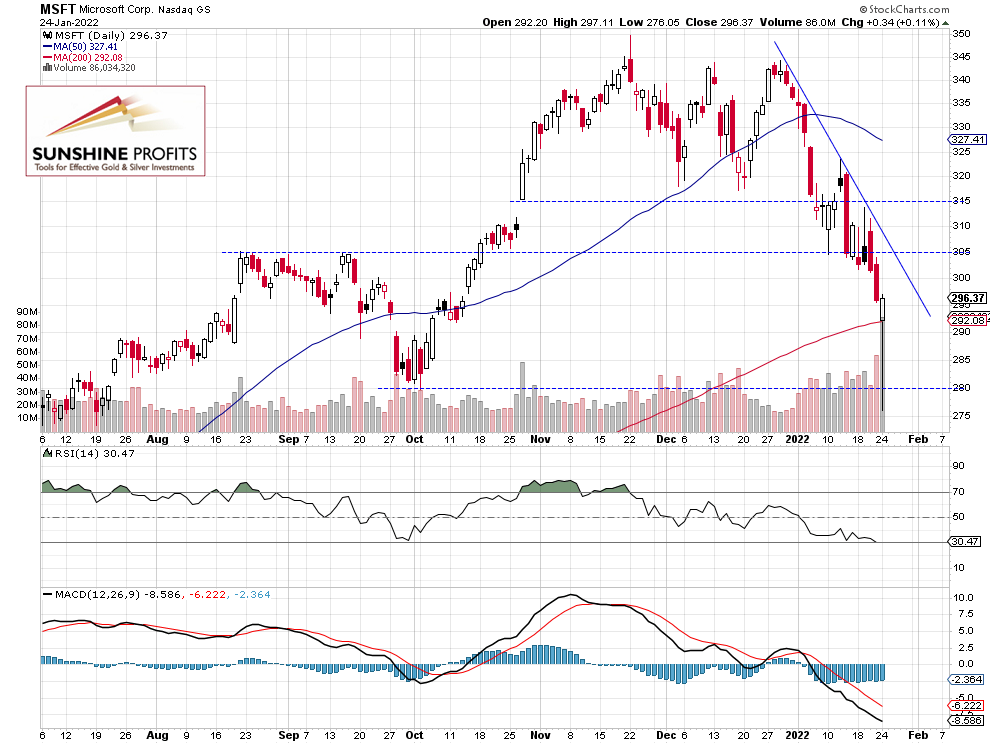
Microsoft (MSFT) will release its quarterly earnings today after the session’s close. It’s an important stock, as it weighs 6.0%, just after the Apple’s 6.7%. So, the S&P 500 traders will be watching that release very closely. Microsoft accelerated its sell-off yesterday and it fell to the local low of $276.05. It was 21% below the Nov. 22 record high of $349.67. The stock remains below the downward trend line, but we can see some clear short-term oversold conditions.
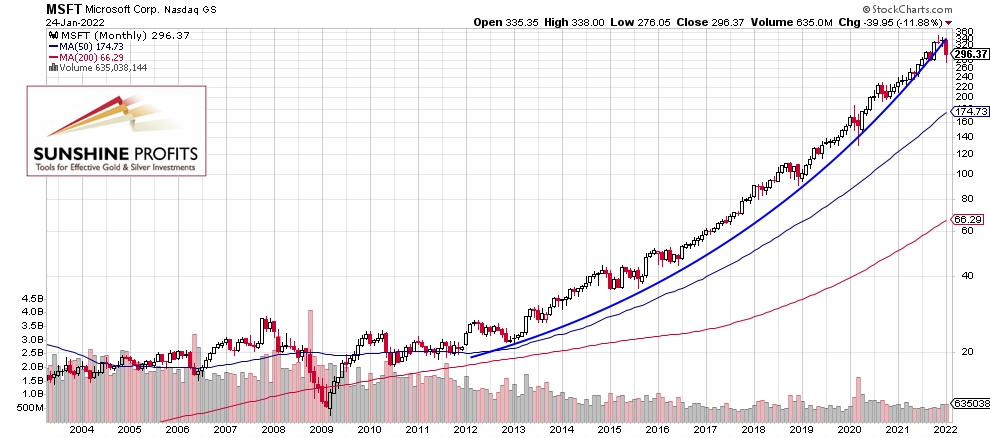
Let’s take a look at the Microsoft’s monthly chart. The stock broke below its multi-year hyperbolic run marked by the thick blue curve. The chart is logarithmic, and we can see an enormous rally that took place since 2013. The breakdown may lead to a change in trend or some medium- or long-term consolidation. It looks like a multi-year bull run is over.
Futures Contract Got Close to the 4,200 Level Yesterday
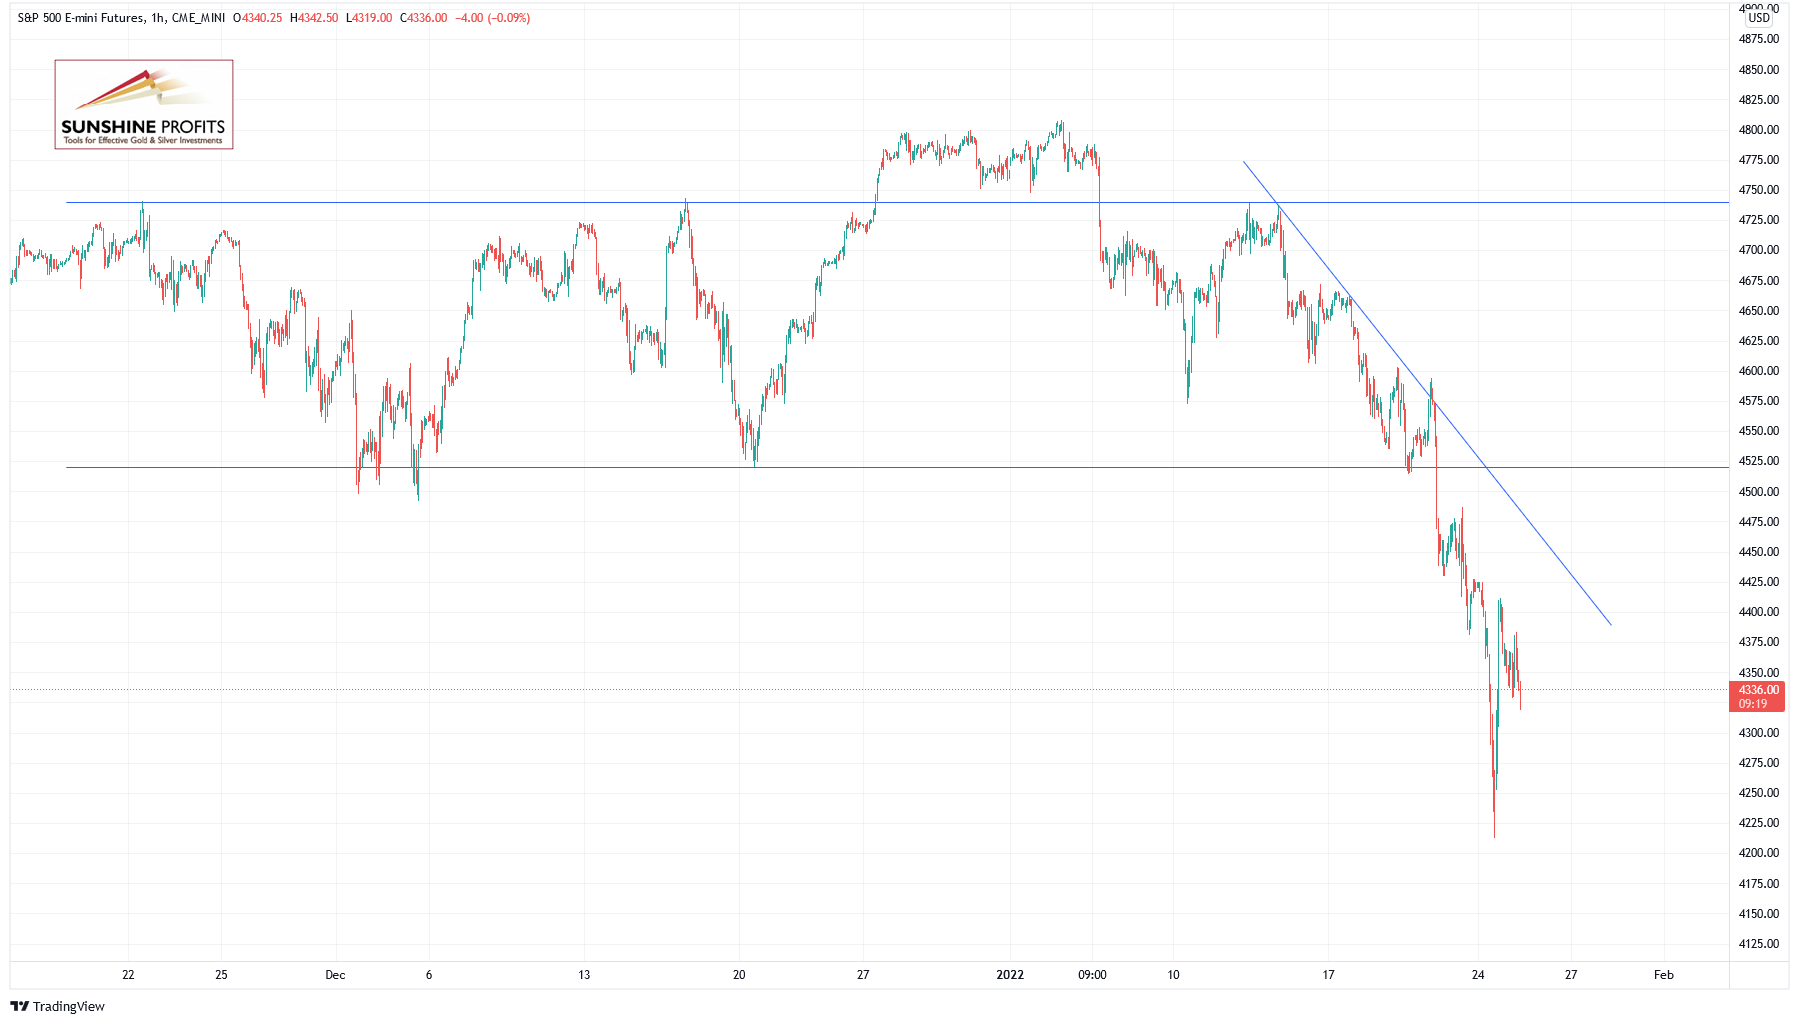
The S&P 500 futures contract accelerated its downtrend yesterday, as it fell close to the 4,200 level. There have been no confirmed positive signals so far, however there are some downtrend exhaustion signals. (chart by courtesy of http://tradingview.com):
Conclusion
The S&P 500 index accelerated its sell-off yesterday and at some point it was 4% lower! But the market rebounded sharply following a “V” pattern reversal and it closed 0.3% higher. This morning it is expected to open 1.6% lower and we may see some further volatility.
The coming quarterly earnings releases (MSFT on Tuesday, TSLA on Wednesday and AAPL on Thursday, among others) remain a bullish factor for stocks, but there is still a lot of uncertainty concerning Russia-Ukraine tensions. Investors are also waiting for tomorrow’s Fed release and Thursday’s U.S. Advance GPD number release. If you want to be in the loop about any future market changes (with instant mail notifications!) sign up for the newsletter here.
Here’s the breakdown:
- The S&P 500 is expected to open lower again; we may see a consolidation.
- Opening a speculative long position is justified from the risk/reward perspective.
- We are expecting a 5% upward correction from the current levels.
Like what you’ve read? Subscribe for our daily newsletter today, and you'll get 7 days of FREE access to our premium daily Stock Trading Alerts as well as our other Alerts. Sign up for the free newsletter today!
Thank you.
Paul Rejczak,
Stock Trading Strategist
Sunshine Profits: Effective Investments through Diligence and Care
* * * * *
The information above represents analyses and opinions of Paul Rejczak & Sunshine Profits' associates only. As such, it may prove wrong and be subject to change without notice. At the time of writing, we base our opinions and analyses on facts and data sourced from respective essays and their authors. Although formed on top of careful research and reputably accurate sources, Paul Rejczak and his associates cannot guarantee the reported data's accuracy and thoroughness. The opinions published above neither recommend nor offer any securities transaction. Mr. Rejczak is not a Registered Securities Advisor. By reading his reports you fully agree that he will not be held responsible or liable for any decisions you make regarding any information provided in these reports. Investing, trading and speculation in any financial markets may involve high risk of loss. Paul Rejczak, Sunshine Profits' employees, affiliates as well as their family members may have a short or long position in any securities, including those mentioned in any of the reports or essays, and may make additional purchases and/or sales of those securities without notice.


![Turbulent Q2'23 Results for [Company Name]: Strong Exports Offset Domestic Challenges](https://www.fxmag.com/media/cache/main_box_filter/uploads/articles/2022-FXMAG-COM/GPWA/gpw-s-analytical-coverage-support-programme-wse-2-6311cd4191809-2022-09-02-11-30-41-63175bda84812-2022-09-06-16-40-26.png "Warsaw Stock Exchange: Brand24 (B24) - 1Q23 financial results")


![Turbulent Q2'23 Results for [Company Name]: Strong Exports Offset Domestic Challenges](https://www.fxmag.com/media/cache/article_small_filter/uploads/articles/2022-FXMAG-COM/GPWA/gpw-s-analytical-coverage-support-programme-wse-2-6311cd4191809-2022-09-02-11-30-41-63175bda84812-2022-09-06-16-40-26.png "Warsaw Stock Exchange: Brand24 (B24) - 1Q23 financial results")

