supply chain

National Bank of Hungary Preview: Embracing the present

Despite a clear deterioration in external risks, we believe that favourable internal developments, accompanied by recent comments from Deputy Governor Barnabás Virág, will tip the balance towards a 100bp cut. However, if the forint continues to weaken markedly, then the previous 75bp pace will likely be maintained.


The decision in December

The National Bank of Hungary cut its key interest rate by 75bp to 10.75% in December. At the same time, the central bank has given clear indications that the pace of rate cuts may be increased if internal and external developments allow, as we discussed in our last NBH Review.


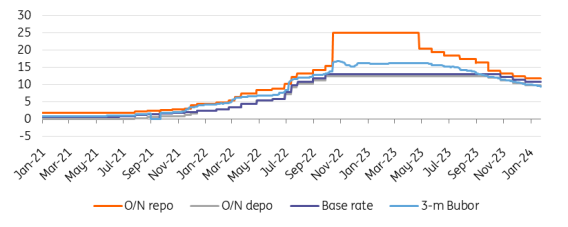
The main interest rates (%)

Source: NBH, ING


Internal developments strengthen the case for a larger cut

Headline inflation fell by 2.4ppt to 5.5% year-on-year (YoY) between November and December, which in fact was a downside surprise compared to our 5.7% forecast. However, what’s more important is that December’s

The Swing Overview – Week 23 2022

The Swing Overview – Week 23 2022

Purple Trading Purple Trading 17.06.2022 08:53
The Swing Overview - Week 23 Major global stock indices broke through their support levels after several days of range movement in response to the tightening economy, the ongoing war in Ukraine, slowing economic growth and high inflation. The Reserve Bank of Australia raised its interest rate by 0.50%. The ECB decided to start raising interest rates by 0.25% from July 2022. The winner of last week is the US dollar, which continues to strengthen. Macroeconomic data Data from the US labour market was highly anticipated. The job creation indicator, the so-called NFP, surprised the markets positively. Analysts expected that 325,000 new jobs had been created in May. In fact, 390 thousand jobs were created in the US. Unemployment is at 3.6%. The information on the growth of hourly wages, which is a leading indicator of inflation, was important. Average hourly earnings rose 0.3% in May, less than analysts who expected 0.4%.   Unemployment claims reached 229,000 this week. This is the highest levels since 3/3/2022. However, this is not an extreme increase. The number of claims is still in the pre-pandemic average area. Nevertheless, it can be seen that since 7/4/2022, when the number of applications reached 166 thousand, the number of applications is slowly increasing and this indicator will be closely monitored.  The ISM index of purchasing managers in the US service sector reached 55.9 in May. This is lower than the previous month's reading of 57.1. A value above 50 still points to expansion in the sector although the decline in the reading indicates  economy.   The yield on the US 10-year bond is close to its peak and is currently around 3%. The rise in yields has been followed by a rise in the US dollar. The dollar index has surpassed 103. The reason for the strengthening of the dollar is the aggressive tightening of the economy by the US Fed, which began reducing the central bank's balance sheet on June 1, 2022. In practice, this means that the Fed will let expire the government bonds it previously bought as part of QE and will not reinvest them further. The first tranche of bonds will expire on June 15, so the effect of this operation remains to be seen. Figure 1: The US 10-year bond yields and USD index on the daily chart   The SP 500 Index The SP 500 index has been moving in a narrow range for the past few days between 4,200, where resistance is and 4,080, where support has been tested several times. This support was broken and has become the new resistance as we can see on the H4 chart.   Figure 2: The SP 500 on H4 and D1 chart   The catalyst for this strong initiation move is the strong US dollar and rising bond yields. Therefore, the current resistance is in the 4,075 - 4,085 range.  The nearest support is 3,965 - 3,970 according to the H4 chart. The next support is 3,879 - 3,907.   German DAX index Macroeconomic data that affected the DAX was manufacturing orders for April, which fell 2.7% month-on-month, while analysts were expecting a 0.3% rise. Industrial production in Germany rose by 0.7% in April (expectations were for 1.0%). The war in Ukraine has a strong impact on the weaker figures. The catalyst for breaking support was the ECB's decision to raise interest rates, which the bank will start implementing from July 2022. Figure 3: German DAX index on H4 and daily chart The DAX is below the SMA 100 moving average according to the daily and H4 chart. This shows a bearish sentiment. The nearest resistance is 14,300 - 14,335. Support is at 13,870 - 13,900 according to the H4 chart.   The ECB left the interest rate unchanged  The ECB left interest rates unchanged on June 9, 2022, so the key rate is still at 0.0%. However, the bank said that it will proceed with a rate hike from July, when the rate is expected to rise by 0.25%. The next hike will then be in September, probably again by 0.25%. The bank pointed to the high inflation rate, which is expected to reach 6.8% for 2022. Inflation is expected to fall to 3.4% in 2023 and 2.1% in 2024.  Figure 4: The EUR/USD on H4 and daily chart According to the bank, a significant risk is Russia's unjustified aggression against Ukraine, which is causing problems in supply chains and pushing energy and some commodity prices up. The result is a slowdown in the growth of the European economy. The bank also announced that it will end its asset purchase program as of July 1, 2022. This is the soft end of this program, as the money that will flow from matured assets will continue to be reinvested by the bank. In practice, this means that the ECB's balance sheet will not be further inflated, but for now, unlike the Fed’s balance sheet, the bank has no plans to reduce its balance sheet. This, coupled with the more moderate rate hike plans and the existence of the above risks, has supported the dollar and the euro has begun to weaken sharply in response to the ECB announcement. The resistance is 1.0760-1.0770. Current support at 1.063-1.064 is broken and it will become new resistance if the break is confirmed. The next support according to the H4 chart is 1.0530 - 1.0550.   Australian central bank surprises with aggressive approach In Australia, the central bank raised its policy rate by 0.50%. Analysts had expected the bank to raise the rate by 0.25%. Thus, the current rate on the Australian dollar is 0.80%. However, this aggressive increase did not strengthen the Australian dollar, which surprisingly weakened. The reason for this is the strong US dollar and also the risk off sentiment that is taking place in the equity indices.  Also impacting the Aussie is the situation in China, where there is zero tolerance of COVID-19. This will impact the country's economic growth, which is very likely to fall short of the 5.5% that was originally projected.  Figure 5: The AUD/USD on H4 and daily chart According to the H4 chart, the AUD/USD currency pair has broken below the SMA 100 moving average, which is a bearish signal. The nearest resistance is 0.7140 - 0.7150. The support is in the zone 0.7030 - 0.7040. 
German labour market starts the year off strongly

Better Supply Chain Status Contrasted With Ecological Problems And Energy Prices. Situation In Germany Leaves Investors With Mixed Feelings

ING Economics ING Economics 05.09.2022 12:51
With disappointing July trade data, the German economy starts the third quarter on a weak footing Trade is no longer a growth driver but has become a drag on German growth Germany: Exports and imports declined German exports (seasonally and calendar-adjusted) disappointed at the start of the third quarter and dropped by 2.1% month-on-month in July. Imports also decreased, by 1.5% month-on-month, lowering the trade surplus to €5.4bn, from €6.2bn in June. Exports to Russia as a result of the sanctions almost came to a standstill and fell by another 15% month-on-month. Lower energy imports from Russia were the reason for German imports from Russia to drop by more than 17% MoM. Trade is no longer a growth driver but has become a drag on German growth. Since the second quarter of 2021, the growth contribution of net exports has actually been negative. Global supply chain frictions, geopolitical risks and rising production costs are the obvious drivers behind this new trend. Looking ahead, the outlook for German trade is mixed. There is some relief in supply chains and transportation costs. However, at the same time, low water levels, high energy prices and the possible fundamental change in supply chains and production processes on the back of geopolitical uncertainty will be clear obstacles to growth. After yesterday’s encouraging increase in July retail sales, today’s trade data add to the long list of growth concerns for the German economy in the second half of the year. Read this article on THINK TagsGermany Exports Eurozone Disclaimer This publication has been prepared by ING solely for information purposes irrespective of a particular user's means, financial situation or investment objectives. The information does not constitute investment recommendation, and nor is it investment, legal or tax advice or an offer or solicitation to purchase or sell any financial instrument. Read more
Canada's Inflation Expected to Ease in May, Impacting BoC's Rate Decision

Inflation shrinks, crude prices under pressure, supply chain is getting better and let core goods prices decrease

FXStreet News FXStreet News 13.12.2022 15:50
US inflation has come out below estimates, triggering an initial fall in the Dollar. The Greenback has been fighting back, in fear of a hawkish Fed decision. There are reasons to be optimistic about prices moving forward. Inflation is falling – there is no doubt about it. The Core Consumer Price Index (Core CPI) has come out at 0.2% in November, even lower than 0.3% in October. On an annualized basis, November's figure represents 2.5%, far below 6% YoY. Underlying prices are clearly falling. While the knee-jerk reaction was the correct one – stocks jumped and the Dollar fell – the reaction is relatively limited to previous events. Why? The Federal Reserve announces its decision tomorrow. I see this relative Dollar stnregh – EUR/USD jumped 350 pips last time, this time under 100 – as temporary. I expect the Greenback to continue falling, and not only due to these figure, but what is seen beneath. There are reasons to be optimistic. First, headline inflation is set to continue decline as oil prices have come under renewed pressure since the data was compiled. Once falling crude costs reach the pump, America could see another downgrade in prices. Read next: John Hardy (Saxo Bank): I don’t think any single inflation print will unsettle the BoE here, just look at the huge recovery in sterling from the lows | FXMAG.COM When it comes to Core CPI, there are additional reasons to become optimistic. The unsnarling of supply chains have already pushed the prices of core goods down, but there is more in store, especially as the entire world now shifts back to services 0 even China is exiting its draconian policy. Another leg down in cookware, sports equipment and computer chips is still in the pipeline. Another bright spot is the shelter component – or rents. Higher Fed interest rates and rising costs of other things have brought leases down, and these reach official statistics with an even bigger lag. Moving house or renegotiating a contract is an annual ritual at best. Shelter inflation – roughly 40% of CPI – is set to decline. The Fed is aware of these two factors and will be pleased by the data. It takes it into account. The only unnerving part is services-ex-shelter, which is related to wages. That is "sticky" 0 wages do not fall that fast and the data does not provide that much comfort, at least not now. Nevertheless, the fall in other inflationary factors will eventually drag service-sector price rises down. That implies that any recovery in the Dollar may prove temporary. One reason to fade the upmove is the short-term wait for the Fed on Wednesday. Yet beyond the decision, this is probably the Greenback's last stand.
According to Franklin Templeton, small-cap companies, which could be positively affected by factors related changes in manufacturing, have potential

According to Franklin Templeton, small-cap companies, which could be positively affected by factors related changes in manufacturing, have potential

Franklin Templeton Franklin Templeton 02.02.2023 15:54
Why small-cap industrials companies may be poised to benefit from moving supply chains closer to home—thoughts from Christopher Meeker of Franklin Mutual Series. Manufacturing accounts for 8% of US employment, 20% of capital investment and 35% of annual US productivity growth.1 With all the influence this industry has on the US economy, we believe there could be significant positive effects for small-capitalization (small-cap) industrials and materials stocks if more US companies bring their manufacturing efforts back to the United States. In our opinion, this area of the equity market allows for targeted investments in companies that stand to benefit from an increase in onshore manufacturing. YIMBY (yes, in my back yard) Central-bank actions to tame inflation have been affecting economic growth globally. Gross domestic product (GDP) readings have waned in many regions, and consumers have been pulling back on spending as prices have climbed. In China and throughout Europe, the manufacturing sector has been softening as well. However, within the United States, manufacturing output has fared slightly better, remaining in expansion territory January through October of 2022. In addition, many areas of the US economy have shown relative strength. With this in mind, we think the US economy currently offers the most economic promise for the manufacturing sector. Read next: Eurozone inflation: We believe the issue's roots were building up before the war, and some are saying it was groundwork set by the ECB| FXMAG.COM A trend toward US-based manufacturing may be materializing, as we have seen new semiconductor fabrication plant construction and exponential increases in manufacturing construction spending data. Projects supporting growth for semiconductor fabrication, electric vehicle and battery plants, data centers and warehouse/distribution centers now account for approximately 65% of industrial construction starts.2 In addition, recent US legislative measures are incentivizing activities that may increase demand for construction materials and equipment. After pandemic-era supply chain disruption, a desire to improve sourcing and logistics is influencing corporate capital expenditure decisions as well, with money directed toward supply chain fortification. Specifically, we think construction equipment rental and storage companies, cement and aggregate businesses, rebar producers and similar companies may receive the largest effect. We think small-cap companies are good tools for investing in specific areas of the market that may experience a demand tailwind from these manufacturing-related trends. Small-cap companies tend to be more sensitive to US economic growth than their large-cap counterparts, due in part to their domestic client base. For example, small-cap US building products companies generate 90% of their revenue from clients located within the United States, whereas large-cap companies generate 67% of their revenue from domestic clientele.3 So, all else equal, a revenue bump from increased local demand typically moves the needle more for a small-cap company than a large one. The other side of the coin is that small companies are also comparatively insulated from economic headwinds generated outside the United States than their large-cap counterparts, in our opinion.   Exhibit 1: US Small- and Large-Cap Companies, US and Non-US Revenue Base Revenue Share of Companies in Russell IndexesAs of December 20, 2022 Sources: FactSet, Russell Investment Group as of December 20, 2022. The Russell 2000® Index measures the performance of the small-cap segment of the US equity universe. The Russell 1000® Value Index measures the performance of the large- cap value segment of the US equity universe.  Indexes are unmanaged and one cannot directly invest in them. They do not include fees, expenses or sales charges. Past performance is not an indicator or a guarantee of future results. Incentivization nation Recent federal stimulus programs are aimed at encouraging investment in US infrastructure, including incentives for reshoring US supply chains. These programs include the Infrastructure Investment and Jobs Act (IIJA), the Inflation Reduction Act (IRA) and the CHIPS (Creating Helpful Incentives to Produce Semiconductors) and Science Act. We see this legislation as positive for small-cap value stocks, as they are designed to stoke demand across various aspects of the supply chain and incentivize a multitude of projects. The IIJA has set aside US$550 billion for spending on various forms of infrastructure such as new roads, highway improvements, bridges and mass transit systems. More spending on highways can mean increased demand for cement, steel, asphalt and other aggregates, in addition to machinery and construction rentals. The IRA creates multiple improvements to the US’ clean energy practices, electronic vehicle manufacturing, battery cell manufacturing and HVAC system electrification. This means demand should increase for metals such as copper, as well as places to assemble electric vehicles and batteries, which require building materials to erect. The US$78 billion in manufacturing subsidies the CHIPS and Science Act offers could also have far-reaching effects. Each semiconductor plant built as a result of the Act not only improves the ability of goods makers to access semiconductors, but also requires its own input of cement and aggregates, rebar, construction equipment, copper wire and construction site rentals, all generating potential demand for products from companies in the small-cap value investable universe. Bring it home Sourcing difficulties during COVID-19 taught companies the benefits of having a more regionalized supply chain. In addition to benefiting from government incentives, companies may see fewer logistical complications and costs due to shorter shipping routes and increased inventory stability that can come from a local workforce producing components in local factories. Several US-based companies have already announced or broken ground on new semiconductor production facilities located stateside, such as semiconductor companies GlobalFoundries, Intel and Texas Instruments. In early October, Micron Technology announced plans to build the largest semiconductor fabrication plant in US history in upstate New York. Micron estimates it will spend more than US$100 billion on the facility over the next couple of decades. In addition, we have observed data points which we think support a trend toward reshoring. For example, US manufacturing employment has surpassed pre-pandemic levels. This is the first time since 2000 that the sector has reclaimed the jobs lost in an economic downturn. Exhibit 2: US Manufacturing Employment Trends US Nonfarm Payroll Employment: ManufacturingJanuary 1991–November 30, 2022 Source: US Bureau of Labor Statistics, data as of November 30, 2022. Also, we’ve analyzed data from the US Census Bureau’s Construction Put in Place monthly report to see if there is corroborating evidence to the rebounding manufacturing employment levels. While broader manufacturing industry construction spending remains below prior peak levels, the computer, electronic and electrical manufacturing sub-category has not only rebounded sharply since 2021, it’s at the highest real-dollar level since 2005. We believe this suggests the United States is seeing some reshoring for higher value-added products. According to one estimate, an effective reshoring of the US manufacturing sector could boost US GDP by US$185 billion by 2030.4 That’s quite the upswing, and a lot of increased demand for products and services that economically sensitive small-cap industrials and materials companies could potentially meet. Endnotes Source: McKinsey Global Institute. Source: Dodge Construction, KeyBanc Capital Markets Inc., as of October 31, 2022. Source: FactSet, Russell Investment Group as of December 20, 2022. Source: IHS Markit (January 2021 forecast); OECD; McKinsey Global Institute analysis.   WHAT ARE THE RISKS? All investments involve risks, including possible loss of principal. The value of investments can go down as well as up, and investors may not get back the full amount invested. Stock prices fluctuate, sometimes rapidly and dramatically, due to factors affecting individual companies, particular industries or sectors or general market conditions. Value securities may not increase in price as anticipated or may decline further in value. Investments in foreign securities involve special risks including currency fluctuations, economic instability, and political developments. Investments in developing markets involve heightened risks related to the same factors, in addition to those associated with their relatively small size and lesser liquidity. Actively managed strategies could experience losses if the investment manager’s judgment about markets, interest rates or the attractiveness, relative values, liquidity or potential appreciation of particular investments made for a portfolio, proves to be incorrect. There can be no guarantee that an investment manager’s investment techniques or decisions will produce the desired results. Any companies and/or case studies referenced herein are used solely for illustrative purposes; any investment may or may not be currently held by any portfolio advised by Franklin Templeton. The information provided is not a recommendation or individual investment advice for any particular security, strategy, or investment product and is not an indication of the trading intent of any Franklin Templeton managed portfolio.
Navigating the Polish Real Estate Market: Assessing the First 5 Months of 2023

World trade to see big shifts and weaker growth in 2023

ING Economics ING Economics 20.04.2023 15:34
World trade has been falling, but we still expect growth to return this year. We do notice large shifts in world trade as advanced economies – especially the US – are diversifying input sourcing. With extreme pandemic effects fading, supply chain problems are unlikely to return at the scale seen in recent years Port of LA and Long Beach World trade has been contracting Since the end of last year, world trade has shown clear signs of weakness amid softening demand. Since September, world trade has fallen by more than 5%. When looking at where demand has weakened most, it is interesting to see that the drop in imports was pretty evenly split between the large economic blocs. It is therefore not a story of falling European gas imports, but more a reflection of weaker economic activity related to goods. Trade has been correcting in recent months in both advanced and emerging markets Source: CPB World Trade Monitor, ING Research   China and other emerging Asian countries have seen the largest declines in export growth as global demand has weakened. When looking at how world trade has developed since the start of the pandemic, we saw a very fast recovery after the first lockdowns which was mainly due to fast export growth from Asia and import growth from the US and eurozone. When economies reopened more fully, we saw a moderation in trade growth which has now morphed into outright losses. The pandemic shock to global consumption has likely played a large role in trade trends in recent years. The initial phase of the pandemic resulted in lopsided consumption towards goods, which has now reversed towards services demand. Supply chain problems are easing rapidly The main problems around world trade in 2021 and 2022 were related to supply chains. Transport costs soared on the back of container shortages, lockdowns caused production stops and inputs were in short supply. This resulted in soaring costs, high supply delivery times and depleted inventories. Since the middle of last year, more or less coinciding with the peak in world trade, we've started to see a turnaround in supply chain problems. They have eased substantially since then as global demand for goods has weakened and production capacity has been improving. Arrival availability of container vessels has also improved to 60% in February 2023 compared to 30% at the start of 2022 which helps to improve the global supply system. Supply chain issues have faded quickly in recent months Source: New York Federal Reserve Bank Lower commodity prices suggest supply and demand are balanced better From the perspective of input shortages, it has become clear that high prices over recent years have consistently come down for key commodities. Looking at the main commodities followed by the World Bank, we see that many have fallen dramatically since their peak. Over the last three months for which data is available, which is through February, most large commodities have seen declining prices. At the same time, we still see elevated price levels for many. This suggests that we’re currently in a period of normalisation for input prices, though distortions are continuing to impact some. Commodity prices are normalising but most are still well above pre-crisis levels Source: World Bank Don't expect supply chain problems of recent past to return The broad-based supply chain problems of recent years share a root in the pandemic. Thanks to sizable government and monetary intervention, incomes in advanced markets stabilised or even jumped despite a huge drop in GDP. In terms of consumption, services were very restricted, which resulted in outsized demand for goods. This resulted in overheating global demand for goods while supply was still very restricted because of pandemic-related limitations, and because businesses had scaled back production capacity. This rare mismatch of supply and demand resulted in extraordinary imbalances and broad-based shortages. Read next: Asia week ahead: Bank of Japan’s first meeting with new governor| FXMAG.COM Since then, demand has been normalising as services are more widely available again. For many inputs, quickly created new production capacity is coming online and resulting in higher production. This has resulted in rapidly improving supply chain problems. The lesson for the future is that the unique nature of the shock allowed for such widespread problems to occur. While we expect that shortages will continue to feature on the economic agenda as labour shortages remain more persistent and the energy transition could lead to new supply squeezes, we do deem it unlikely that similar broad-based shortages will return without a shock the size of the pandemic. Container spot rates on major trade lanes dropped steeply from highly elevated levels Weekly port to port containerised freight tariffs in $ per FEU (40 ft container)* *last data point: 04/14/23 Source: Clarksons, ING research Container rates have bottomed, supporting trade The exceptional mismatch in supply chains has clearly been reflected in container rates. After sliding from peak levels for a year, container spot rates stabilised just above pre-pandemic levels in the first quarter of this year. Early April spot rates are some 75% lower than the average of 2022 on the China-US West Coast trade route, and on the China-Europe trade route, the decline is over 80%. This means point-to-point transport costs of newly arranged 40ft container slots are $4,000-9,000 lower than last year’s average. This is significant and could support trade in lower-valued or voluminous consumer products. At the start of 2023, over 50% of global container volume was fixed in term contracts, with locked-in higher rates, but most of these expire over the course of the year, after which lower rates for shippers will materialise.   In contrast to container costs (consumer goods), transport costs for oil and oil products have surged due to disrupted energy markets. But given that the transport costs of oil products relative to their value is limited, there are more important drivers for oil trade than these costs, which tend to have a bigger impact on lower-valued consumer products.   High inventories and reduced goods spending corrected trade volume With the continuous supply chain disruptions in mind, shippers started ordering and replenishing inventories earlier in 2022, betting on continued strong consumer demand. However, over the course of the year, consumers reduced spending on goods amid spiking inflation and their priorities shifted back to services. This put pressure on shippers to moderate mounting stock levels, especially in downstream retail activities. While the ‘bullwhip effect’ of stockpiling across the supply chain added to trade volumes earlier, the process of stock reduction has since created extra slack in the figures. Although this process has not yet finished, we expect trade to recover mildly over the course of this year on the back of the reopening of China, starting at the end of the first quarter. All in all, we expect total trade to grow at just 1% compared to last year, with 2024 offering a 2% gain in trade volume. This means trade should drop below global GDP growth and will continue to progress slowly compared to long-term averages. World merchant trade growth to lag GDP development in 2023-2024 (Development volume in %YoY) Source: IMF, CPB, ING research The correction is not necessarily the start of deglobalisation though... It would be an easy conclusion to say that this drop in world trade marks the first evidence of deglobalisation. But the chart below shows that this is not in fact a logical conclusion to draw from recent developments. Industrial production has also not performed very well recently, which means that our measure of globalisation (world trade as a share of global production, which gives a timely view on trade openness) has not moved outside of the general band that we have seen since roughly 2006. Before then, we saw a rapid increase in globalisation, but it has since plateaued. So despite supply chain problems, geopolitical risks and production disruptions due to the coronavirus, we have not had a meaningful deviation from the stable trend in globalisation seen in the past 15 years. Of course, it’s important to note that a global trade openness indicator does not capture all the nuances of globalisation. Nearshoring elements are not captured by this indicator for example. So below we take a deeper look at how trade is changing. Globalisation measures are relatively stable despite falling world trade Source: CPB World Trade Monitor, ING Research   We do see that trade patterns are shifting though. Think of Russia as the most extreme example. The sanctions on Russian exports have led to a restructuring and rebalancing of global oil, and other commodity flows as well as more traded LNG across the globe. European oil imports from Russia have been replaced by imports from places such as the Middle East, while Russia exported more to India and China. And more European coal is now supplied by e.g. Columbia, South Africa and Australia. Diversification of trade is well underway But more broadly, it looks like diversification of sourcing products is the most dominant response to supply chain problems seen in recent years. That is not just the case anecdotally and indicated in surveys, we also find this when looking at import country concentration. To gauge whether trade has been diversifying in terms of countries, we use a Herfindahl–Hirschman index to determine concentration. Using the IMF DOTS dataset on trade, we can go back several decades to find how concentrated or diversified imports have been for advanced markets. Concentration of import sourcing has been the trend since 2016 Source: IMF DOTS, ING Research calculations   Over recent years, in fact already since 2016, we have seen steady declines in our import concentration index for advanced economies. This indicates that we indeed see some form of diversification happening in terms of imports from different countries. The pandemic caused some shocks – as it did almost everywhere – related to which countries were open and which weren’t, but in the end, it looks like the previous trend has picked up again as the world is slowly normalising. Interestingly, we do see notable differences between Europe and the US. In the EU, we note relatively little diversification so far outside of the pandemic shock. The latest data shows a similar level of the import concentration index as in the period between 2004 and 2019. The US is the main diversification force at the moment. American imports are now a lot more diversified than they were in 2016 and this is mainly driven by a clear trend towards a lower dependence on China for imports. For EU countries, dependence on China was already lower and has so far only seen some declines in 2022. This could also just be a lockdown effect as the share of China in EU imports has not fallen below 2019 levels so far. In fact, the EU is still fairly close to its peak in terms of China dependence for imports going all the way back to 1960. Developments in imports from China very different between EU and US Source: IMF DOTS, ING Research calculations   When looking at the ‘winners’ over recent years, or the countries that gained the most share as exporters to advanced economies, a few trends stand out. First of all, since this is measured nominally, energy – and other commodity - exporters are among the obvious winners given the recent energy crisis. The question is how sustainable this is once prices normalise. Other than that, we also see Taiwan, India, South Korea and Vietnam standing out as countries increasing their export shares to advanced economies. But the same holds true for Mexico, Poland and Spain, so maybe underlying developments do allude to some near- or reshoring after all. The drop in import concentration in the US is largely driven by China Source: IMF DOTS, ING Research calculations   China stands out as the country that saw its share of total exports to advanced markets decrease the most, although this will have been overstated by Covid-related turmoil. Still, geopolitics does seem to play a role here as this is a broader trend starting around the time of the trade war. We also see weaker FDI coming into China, which is a harbinger for future trade activity. Also, Germany lost global market share, likely also affected by supply-chain problems affecting production. Overall, the movements in advanced economy export shares are relatively small, indicating that the structural shifts in global trade are gradual movements. China by far the largest supplier of green technology essentials The share of China in global green technology supply chains per segment, 2021 Source: IEA, ING Research Protectionism and supply chain lessons weigh on sourcing from China, but self-sufficiency is easier said than done Although US imports started to diversify before 2020, with less coming from China and more from other Asian countries, this trend has been accelerated by the lessons learned from the pandemic. However, the role of China in global trade remains enormous and is in some cases near-impossible to change in the short- to medium-term. This is particularly true for green technologies which are rapidly increasing in importance in the energy transition – the world is highly dependent on China. The US and Europe are rushing to create their own supply chains for batteries. But China still accounts for 75% of the supplies and for the refinery of battery materials, China is also a crucial link. Nevertheless, in general, the downward trend in China's market share to the US is quite clear and the path of diversification has started slowly but surely. Large container liners like CMA CGM recognise a trend of diversification, but also emphasise this is a long-term process and underdeveloped (port) infrastructure plays a role in this regard. Supply chain reconfiguration of companies with lessons learned from recent supply chain disruptions is an important recent trend. Companies explain in surveys that reorientation and diversification of sourcing are part of their process to build resilience. This could involve shifting (part of their) production to another country.       It's too early to call the start of deglobalisation, but far from business as usual Overall, world merchant trade is still digesting the effects of two major shocks seen in recent years. The pandemic extremes caused a lot of problems related to supply being curbed and demand overheating, these issues seem to be easing rapidly at the moment and we don’t expect supply-chain issues on the same scale as that seen in recent years anytime soon. At the same time, geopolitical problems are heating up and are starting to have more of a structural impact on world trade. While deglobalisation is a hot topic right now, we don’t see much evidence for it actually happening. We do see that advanced economies are diversifying trade partners, mainly in the US, while in Europe, this trend is likely to take more time. But we still see this happening as higher trade barriers and continued geopolitical concerns are likely in the years ahead. For the coming years, this means that we can expect just modest growth in world trade, hampered by geopolitical factors, but experiencing some improvement from the fading of pandemic effects. Read this article on THINK Disclaimer This publication has been prepared by ING solely for information purposes irrespective of a particular user's means, financial situation or investment objectives. The information does not constitute investment recommendation, and nor is it investment, legal or tax advice or an offer or solicitation to purchase or sell any financial instrument. Read more
US electric vehicle market set for sustained growth despite stricter subsidy rules

Is automotive branch getting better after months of supply chain issues and chips shortage? HFM Analyst talks Toyota, Volkswagen and BMW earnings

Marco Turatti Marco Turatti 12.05.2023 12:24
For many months now it's been terribly hard for anybody to order a car you really want with every selected features. Supply chain issues and chips shortage made it a big challendge for automotive branch to produce cars effectively and sell them for a reasonable price. That's why we ask HF Markets analyst, Marco Turatti about the industry state and earnings of Toyota, VW and BMW. FXMAG.COM: Is automotive branch getting better after months of supply chain issues and chips shortage? Please comment on Toyota, VW and BMW earnings. Marco Turatti (HF Markets): In 2023, a fairly strong global automotive market is expected, with global production growth of 3% thanks to a more stable supply chain (as well as more stable raw material prices). That is according to JPMorgan, at least. The supply side of semiconductors started to improve in 2022 thanks to an increase in productive capacity at the same time that a decline in sales in the consumer electronics sector allowed resources to be shifted towards the automotive market (as happened in Taiwan), which is in full swing due to the transition to electric. However, the fact that cars are using increasingly powerful and specific chips could give rise to new bottlenecks towards the end of the year that are expected to be fairly minor. Read next: Even though JPMorgan Chase and Wells Fargo, reported solid earnings, their reports showed weakness in deposits and declines in net interest income| FXMAG.COM Marco Turatti (HF Markets): The renewed availability of productive factors will unleash competition worldwide but especially on the Chinese market, the largest in the world (and where 'small' local producers are eating up market shares); at the same time it is expected that demand may slacken mainly in Europe (according to BMW). Toyota plans to multiply its production of purely electric vehicles (non-hybrid) by 5 to 202,000 units before March 2024 Marco Turatti (HF Markets): Looking at TOYOTA, which was the last to present results on 10/05, it plans to multiply its production of purely electric vehicles (non-hybrid) by 5 to 202,000 units before March 2024. VOLKSWAGEN will try to recover the lost market share in the Asian giant (sales -14%, offset by good data in the EU and the US), focusing however on maintaining positive margins as close as possible to 8% as they are for the traditional combustion engine segment: therefore, the focus will not be on volumes or price reductions. This low margin stress situation was more pronounced for European producers, where supply chain problems were felt more than in other areas in 2022: for example, BMW also adopted a pricing strategy opposite to Tesla's, raising prices on average. Revenues increased by 28% ($142.6B) while earnings registered +12%, less than what analysts expected. Marco Turatti (HF Markets): In any case, everything points to a healthy 2023 for the automotive market and a competition that is once again more intense due to the full availability of productive factors.
EXMO.COM analyst: Currently, Tesla is still trying to conquer the market by prioritising revenue over profit

Toyota’s (TM) Q1 profit edged up 3% from the previous year on robust sales. Are automotive companies’ share prices currently undervalued?

David Kindley David Kindley 12.05.2023 12:25
We continue to share analysts thoughts on automotive industry. Earlier today we published a comment of Marco Turatti. This time it's over to Orbex's David Kindley. David Kindley (Orbex): In 2022, automakers worldwide were hit by a shortage of computer chips and other auto parts due to the global supply chain disruptions caused by the pandemic. In 2023, with supply chain bottlenecks finally easing, the world's biggest car makers have reported very strong Q1 earnings despite being faced with slowing global demand, persistent inflation, and higher raw-material costs. Toyota Q1 earnings David Kindley (Orbex): Specifically, Toyota’s (TM) Q1 profit edged up 3% from the previous year on robust sales. The automaker posted a sharp increase in sales for its first annual report offered under new Toyota CEO Koji Sato with $4 billion in quarterly net profit, up from $3.9 billion in the previous quarter. Quarterly sales also soared nearly 20% to $72 billion. The strong earnings came despite Toyota stating that soaring raw material costs also affected its bottom line. Read next: It should be noted that BoJ’s decade-long ultra-loose stimulus program has drawn intense criticism for broadening price pressures in the world's third-largest economy | FXMAG.COM Volkswagen Group in the first quarter of 2023 David Kindley (Orbex): Meanwhile, Volkswagen Group posted a solid start to the 2023 fiscal year, with operating profit before valuation effects from commodity hedging, increasing by 35% to $7.8 billion. VW’s first-quarter sales revenue also rose by 22% to a total of $83 billion, driven by a recovery in sales volumes in Europe and North America. BMW AG Q1 earnings beat expectations David Kindley (Orbex): In the case of BMW AG, the company’s first-quarter earnings also beat expectations, even though the company left its 2023 outlook unchanged due to softening global demand. Specifically, the carmaker reported an automotive earnings margin of 12.1% and pledged to boost earnings per share with a new $2.2 billion share buyback program. David Kindley (Orbex): It’s important to note that as most automotive companies’ share prices are currently undervalued, they could present solid long-term “buy and hold” opportunities for traders and investors.
Revolutionizing Construction! Circular Solutions in Construction: Leading the Path Towards Sustainable Building Practices

Revolutionizing Construction! Circular Solutions in Construction: Leading the Path Towards Sustainable Building Practices

ING Economics ING Economics 29.05.2023 08:41
Moving towards a more circular construction sector Circular construction model: entire supply chain involved In order to change course, begin reducing construction waste and increase the circularity rate, not only contractors but the whole construction value chain must be involved. For circular construction to be as high-grade as possible, the business model of all supply chain partners has to change. Architects and owners have to decide whether old buildings will be reused or demolished, as well as how buildings can be easily converted for new owners.   All supply chain partners need to embrace circular principles to make the process a success.     For instance, they may opt for more sustainable construction methods such as timber construction. Suppliers can offer bio-based materials (e.g. wood, straw, flax and hemp), and demolishers can ensure that building materials are reused at the highest possible grade. All supply chain partners – from owner and architect to demolisher – need to embrace circular principles to make the process a success.   Most opportunities for wholesalers and demolishers For demolishers, opportunities exist in circular construction through smart demolition. They can extract whole building parts from a demolition site by dismantling the building in a way that specifically allows these parts to be reused.   Distribution of such materials provides new opportunities for wholesalers, who have networks of contractors and can therefore buy used building materials to sell again. If the trend of circular construction continues, this will result in fewer sales of new building materials for suppliers, as "old" building materials are reused more frequently.   The chart below summarises the most important changes to be made for the circular construction process to be able to take place. See further our circular construction report which answers the following questions: Is there a demand for circular construction? How does circular construction work? What are the limitations? What role does ‘from ownership to use’ play and for which supply chain partners are there opportunities?   How does circular construction work? Who does what?     An increasing number of construction companies have ambitions in circular construction. Several large European construction companies are trying to promote circular construction, decreasing the amount of waste and improving the circularity rate. Here are some examples:   Bouygues Construction Bouygues Construction is transforming its building processes in the supply chain to implement circular economy strategies. To do so, they've outlined four priorities: selecting sustainable and recyclable materials in the design phase, reducing the amount of resources used during construction, recovering and re-using materials on-site and recycling materials. At Hôtel des Postes, Bouygues re-used structural components, doors and external joinery along with various other building parts. For instance, they repurposed the old carpet for new insulation.   Skanska Skanska focuses on resource efficiency by reusing and recycling materials and products where possible. Concrete, demolition waste, mixed construction waste and wood are the four largest waste types for the company. They reduce waste with smarter design, planning, procurement and logistics.   In 2022, 72% of total waste was recycled, 8% was set for reuse and 13% received another waste treatment. 6.8% of generated waste went to landfill, which does not yet meet the company's target of less than 5%. Skanska applied circular solutions during the construction of the office building Epic in Malmö, using concrete from the Copenhagen metro, excess bricks from the Epic façade, window frames and beams from other demolition projects, and recycled PET bottles for sound-absorbing canvas in the façade.   Hochtief Hochtief has a sustainability plan, with goals for 2025 outlining various targets. Circularity is just one of the dimensions, with targets including an 80% recycling rate of waste in 2025 and a consecutive increase thereafter. In 2022, the recycling rate hit 88.7% – already exceeding the original target.   Promoting life-cycle analyses by actively engaging clients in at least 200 building projects in 2025 is yet another target. Hochtief also intends to increase the proportion of projects in which the used materials are digitally logged by at least 10% per year, which should make the reuse and dismantling of used building materials simpler.   Royal BAM Group Circularity is one of the six key themes for BAM’s sustainability strategy. In the short term, it aims to enhance the transparency of material usage and offer circular construction methods. The company's circular construction initiatives include the "Madaster Platform", a digital tool that documents the materials used in construction projects and promotes their reuse.   By 2030, BAM plans to reduce non-biobased materials by 50% compared to 2019 levels. Additionally, the company strive to reduce its production construction process and office waste by 75% by 2030 compared to 2015 levels.   Looking ahead, cooperation remains key It's now become critical for a real shift to take place in the construction sector if rising waste levels are to have any chance of falling. Stronger regulation could solve one part of the puzzle, but the transition needs to be covered every step of the way – from clients and contractors to demolishers and the building material industry.   Larger construction companies are already adopting circular policies to help turn the tide, but smaller companies must also step up efforts for any real change to occur. The construction sector is very fragmented, with a high number of these smaller firms playing a key role – and it's crucial that action comes from all sides moving forward.
DCF Valuation with Assumptions: Risk-Free Rate, Market Premium, Beta, and Growth Rate

Challenges and Risks in Poland's Solar Power Industry: Connection Issues, Regulation, Supply Chain, and Transition Delays

GPW’s Analytical Coverage Support Programme 3.0 GPW’s Analytical Coverage Support Programme 3.0 19.07.2023 08:36
Problems with new connections to the power system are now apparently a slowing factor for the development of solar power in Poland. More than 13GW of photovoltaic capacity is currently connected in the country, and another 11GW of connections are reserved for offshore wind power.  In recent years, there have been an increasing number of connection refusals issued by grid operators due to years of investment neglect and the need to reconfigure the grid for higher RES use and to include new consumption points, such as EV charging stations. Changes in the regulation of maximum energy prices, freezing energy prices for households introduces uncertainty in the industry regarding the payback period for RES investments and makes it more difficult to obtain financing for projects. Last year, the EC introduced a maximum electricity sale price of EUR 180/MW for RES sources. Some countries, such as Romania, have opted for even more drastic limits on energy prices for RES. In Poland, the government froze energy prices in the G tariff (households) in 2023 at the 2022 price level.It is worth noting that in the case of installing energy storage, the DNO (distribution network operator) must agree to an additional connection corresponding to the capacity of the source (i.e. PV installation of 20MW + storage of 2MW = connection for 22MW). The situation in the coming months may be improved by the amendment to the law being processed in the Sejm and Senate (after the first reading, without amendments in the Senate) giving the possibility to apply a direct connection to the consumer (industrial plant) bypassing the DNO.     Changes in the regulation of maximum energy prices, freezing energy prices for households introduces uncertainty in the industry regarding the payback period for RES investments and makes it more difficult to obtain financing for projects. Last year, the EC introduced a maximum electricity sale price of EUR 180/MW for RES sources. Some countries, such as Romania, have opted for even more drastic limits on energy prices for RES. In Poland, the government froze energy prices in the G tariff (households) in 2023 at the 2022 price level.     Rising interest rates negatively affect the investment attractiveness of RES and make it more difficult to raise capital for construction. Our calculations show that, on a contract with an industrial consumer (PPA), currently at prices of PLN 500- 600/MWh, PV projects pay off in 5-6 years, which still gives an attractive rate of return. On the other hand, higher interest rates and bank interest rates are increasing competition for funds to build new RES projects     Availability of components to build PV farms could be a problem for the industry in the future. In 2021-22, due to fractured supply chains from Asia and galloping deep-sea freight prices, the price of components (inverters, PV panels) became noticeably more expensive and their availability was hampered. China currently supplies more than 70% of the world's PV modules. Recently, China has also threatened to impose tariff barriers on the export of semiconductors, which are also used in PV farms     The delay in transferring coal power assets to NABE is prolonging the energy transition process in Poland. Currently, the authorities are supporting the mining sector and coal-fired power generation reluctantly, considering the shutdown of troublesome units such as Turów. Despite clear decarbonization trends in the EU, a number of investments in power units like Opole and Jaworzno have been made in Poland in recent years. Azoty Group is probably building the last new coal-fired unit in Pulawy. A more favourable view of renewable energy in Poland would likely accelerate the sector's transition.     Prolonged land preparation processes for farms next to grid connection conditions are the biggest brake on the industry's development. In order to prepare a photovoltaic farm project, construction permits and development conditions are necessary. It is becoming practically impossible in Poland to erect farms on agricultural land. It seems promising to erect farms on postindustrial land, which, on the one hand, often already has a connection to the grid, but on the other hand, requires additional expenditures on reclamation (there are sources talking about 1mn hectares of post-industrial land in Poland that can be developed by solar and wind power).     Risk of losing a key customer. Novavis is currently developing farms with a capacity of more than 400MW for Iberdrola under a payment-per-project-phase formula. The loss of a key customer could result in the need to look for an alternative buyer in the market, or a form of financing for the development. The market is currently more on the side of project sellers than buyers.     Liquidity risk. At the current scale of operations, Novavis has to pay a deposit to the DSO in the process of obtaining a grid connection (PLN 30,000/MW; which roughly translates to a freeze of PLN 17mn for more than 570MW of farm capacity). The deposit is not interest-bearing. Significant increases in operations may require significant spare funds.  
Collapse of Black Sea Grain Initiative Rattles Market: Impact on Ukrainian Grain Exports

Transforming the Steel Supply Chain: The Impact of Green Steel Transition

ING Economics ING Economics 19.07.2023 11:38
Green steel transition could trigger changes in the supply chain As companies begin to drive change, they are likely to change the business models in the steel industry too. Currently, most steel plants take care of the entire steelmaking process. Iron ore is turned into iron and steel at almost every production site. The first step of turning iron ore into iron is by far the most energy and carbon-intensive step, accounting for around 80% of emissions in coal-based steelmaking. In future, this process may be relocated from regions with high energy and hydrogen costs towards those with lower costs. Australia, the Middle East and the US, for example, are likely to have a competitive advantage in the production of hydrogen. Production of iron may be concentrated in these regions and then shipped to higher-cost regions such as Europe as Hot Briquetted Iron (HBI). Alternatively, it may be relocated within Europe to regions with low electricity prices from green sources such as the northern parts of Norway and Sweden, which have ample space available and a large supply of hydropower that can act as a baseload for green steel production. In that respect, it isn't surprising that the most advanced plans for a green steel mill are in the city of Boden in Sweden. HBI is a compact form of Direct Reduced Iron (directly turning iron ore into iron with hydrogen instead of coal). The briquettes are made to be shipped over long distances and in such a way that they can be melted and turned into steel easily. This second step can be done in electric arc furnaces, which electrifies and greens the process of steelmaking further – provided that the furnace is powered with low-carbon power sources such as solar panels, wind turbines, hydropower plants or nuclear power plants. While steelmaking is for the most part an integrated business, the supply chain might evolve towards more global production hubs of pure forms of iron and local sites that specialise in the last step of turning iron into different qualities of steel.   Slow progress but more opportunities ahead The steel sector is widely regarded as a conservative sector that is characterised by large incumbents that rely on coal-based technology. Entry barriers are high and hence change has been slow. Technology now provides important opportunities for greening the industry, either by applying CCS to the current coal-based technology or by redesigning the process of turning iron ore into iron with hydrogen instead of coal. That may sound radical, but is in fact a form of evolution rather than revolution. The technology of direct reduced iron is already applied in gas-based steelmaking. Green and blue hydrogen can take over once they are abundantly available. Electrification could further green both routes by replacing basic oxygen furnaces with electric ones.
European Markets Face Headwinds Amid Rising Yields and Inflation Concerns

Navigating Change: Implementation and Impact of America's Inflation Reduction Act on the Clean Energy Industry

ING Economics ING Economics 17.08.2023 11:52
Implementation guidelines continue to arrive, though uncertainties remain The key to the smooth implementation of the IRA is clear rules on who is eligible to get what amount of tax credits or other types of funding. To address uncertainties, the Internal Revenue Service (IRS) and the Treasury Department have been working to publish detailed guidance throughout the past year. Some of the guidelines include   RA guidance examples   These rules – despite the need for more refining – are useful for project developers and investors to determine tax credit eligibility, estimate revenue streams, evaluate project outlook, and advance investment decisions and project development. They are also reshaping the structure and components of the US clean energy supply chain, which will be discussed further below. Nevertheless, the guideline setting remains a work in progress, and market players in certain clean energy areas are still waiting tentatively for new guidelines. For instance, the IRS and Treasury have not yet released guidance on hydrogen tax credits. For now, two major uncertainties remain: how renewable electricity (used to produce green hydrogen) is measured and how the carbon intensity of hydrogen delivery is calculated. This determines how clean a hydrogen project is and consequently how many tax credits the project can get. The more quickly guidance rules are out, the faster the projects will be expected to move to their next stages.   Clean energy supply chain set for drastic changes With decade-long tax credits and funding, the IRA is set to have a profound, long-term impact on the US. This means more clean energy will be produced, and supply chains will look significantly different than they do now. Through strict eligibility rules for the highest levels of tax credits, the IRA aims to strengthen the US domestic supply chain of raw materials used for low-carbon technologies, with EV and renewable energy tax credit guidelines incentivising at least parts of the supply chain to reside in North America (originated, manufactured, assembled, or recycled). This move is to counter China’s dominance in the clean energy industry, as the country now accounts for 77% of the global battery cell manufacturing capacity, 88% of solar PV manufacturing capacity, and an average of 50% of wind and electrolyser manufacturing capacity. These requirements are already leading EV manufacturers to explore vertically along the EV value chain. In January this year, General Motors (GM) announced a joint venture with mining company Lithium Americas to gain exclusive access to lithium from a mining site in Nevada, US. Ford will receive a $9.2bn loan from the DoE, the largest single loan in the DoE Loan Programs Office history, to develop battery plants in Tennessee and Kentucky in collaboration with battery company SK Innovations. Tesla, BMW, VW, Hyundai, Honda, and others are also investing in battery manufacturing. The renewable power industry is not yet officially affected by the domestic component Notice of Intent, but partnerships are nevertheless emerging to build assembly capacity in the US. In May, US solar company Invenergy and Chinese solar panel manufacturer Longi collectively announced the plan to build the US’s largest solar factory in Ohio, at a capacity of 5 GW. Similar moves are also being made by other international companies like Hanwha Q Cells, Vikram Solar, Jinko Solar, etc. One risk to note is the additional cost of geopolitical complexities. The US has restrictive tariffs in place against Chinese solar cells and might impose tariffs on Southeast Asian countries to discourage China from rerouting exports. In the long term, these provisions will create a more mature domestic clean energy supply chain. However, it would take time and be expensive. It is estimated that the US will need to invest almost $120bn in lithium-ion, solar PV, electrolysers, and metal refining to meet domestic demand by 2030.   Upfront investment needed in the US to meet domestic clean energy manufacturing demand in 2030 $bn
Nasdaq Slips as Tech Stocks Falter, US Inflation Data Awaits

The State of EU Construction Markets: Challenges and Opportunitie

ING Economics ING Economics 04.09.2023 15:56
Our view on EU construction markets Germany: Four years of contracting building volumesIn the first half of this year, German construction activity declined by 1.4% year-on-year after a decline in 2022 of 1.6%. For 2023, we forecast a moderate contraction of the largest construction market in the EU. The building industry continues to suffer under higher interest rates and increased construction costs, which led to three German project developers – Project Immobilien, Development Partner and Euroboden – filing for bankruptcy in August. Order book assessment of contractors also declined to 3.8 months in the third quarter of 2023 from 4.3 months a year earlier. A sharp decline in building permits for new residential buildings in the first half of this year also signals a further decrease still to come. Along with higher interest rates and construction costs, policy uncertainty regarding sustainability measures in the real estate sector added to the drop in the number of new permits. Spain: Construction sector at a turning pointBy the end of 2022, the production level was almost 25% lower than it was at the end of 2019. Yet, order books are now improving and the EU's recovery fund investments in the Spanish construction sector should generate a more positive outcome moving forward. The increase in permits will also have a positive effect on building volumes – although the question will remain as to how many approved projects will actually be built as challenging circumstances persist. Nevertheless, we have upgraded our forecast for Spain.   EU construction forecast Volume output construction sector, % YoY   The Netherlands: Construction faces sharp decline in 2024We expect Dutch construction volumes to experience a slight growth of 0.5% this year. A small contraction was previously anticipated, but unexpectedly high growth in the first quarter of this year has led to the possibility of ending 2023 with a small increase. Signs of cooling are already evident at the beginning of the Dutch construction value chain, with a visible contraction in project development and the production of building materials such as concrete, cement, and bricks. This trend will continue further down the supply chain. As a result, we expect a contraction of 2.5% in Dutch construction output next year – the largest decline since 2013. This is a relatively large drop compared to other countries. However, the Dutch building sector has performed well in recent years, and production levels should therefore remain at high levels.   Belgium: Low growth for the construction sector in 2023Belgian construction output rose by 0.3% in the first half of 2023. The Belgian construction confidence index has been hovering around a neutral level for months but reached its lowest point of -5.0 in more than two years in July, despite an increase in building production volumes in 2022. The issuance of building permits for both residential and non-residential buildings has decreased over the same period, but more moderately than in other countries. The government's stimulus plans include funding to improve the energy efficiency of existing buildings and funds to rebuild 38,000 homes damaged by the floods in 2021. Overall, we predict that the Belgian construction sector will still experience a low growth rate of around 0.5% in 2023 and 1% in 2024.   Strong development differences among countries Development volume construction sector (Index 2016=100)
National Bank of Romania Maintains Rates, Eyes Inflation Outlook

Bearing Witness to Change: National Bank of Hungary Contemplates 100bp Interest Rate Cut Amidst Shifting Dynamics

ING Economics ING Economics 25.01.2024 16:31
National Bank of Hungary Preview: Embracing the present Despite a clear deterioration in external risks, we believe that favourable internal developments, accompanied by recent comments from Deputy Governor Barnabás Virág, will tip the balance towards a 100bp cut. However, if the forint continues to weaken markedly, then the previous 75bp pace will likely be maintained.   The decision in December The National Bank of Hungary cut its key interest rate by 75bp to 10.75% in December. At the same time, the central bank has given clear indications that the pace of rate cuts may be increased if internal and external developments allow, as we discussed in our last NBH Review.   The main interest rates (%)   Internal developments strengthen the case for a larger cut Headline inflation fell by 2.4ppt to 5.5% year-on-year (YoY) between November and December, which in fact was a downside surprise compared to our 5.7% forecast. However, what’s more important is that December’s figure was 0.2ppt lower than the central bank’s own estimate, published in the latest Inflation Report. Other measures of price pressures also look favourable, as core inflation decelerated to 7.6% YoY in December, while on a three-month on three-month basis, it was below 3%. At the same time, the National Bank of Hungary's measure of inflation for sticky prices also decreased, displaying a reading of less than 8.7% YoY.   Underlying inflation indicators   The country's external balances are also improving, as the trade balance has been in surplus for 10 months, and even reached an all-time high of EUR 1.7bn in November. As for the current account, we have already seen surpluses in the second and third quarters of 2023, and we expect it to remain in positive territory at the end of 2023.   External developments warrant a cautious approach Let’s start with two of the positive developments regarding external risks: We've already seen a dovish pivot from the Federal Reserve, and we expect the European Central Bank to follow suit at some point. This means that the next move for both central banks will be a cut rather than a hike, which in turn means that the HUF carry will not decline as much going forward as it would have if these central banks were still in rate-hiking mode. Even though rate cut expectations have been slightly dialled down compared to the time of the December NBH meeting, the direction of travel is favourable for emerging market currencies, including the HUF. One of the key uncertainties has been removed with the positive decision of the European Commission on the horizontal enablers (judicial reforms). With Hungary now having access to around EUR 10.2 bn of Cohesion funds, this could increase risk appetite towards Hungary and support market stability. Container freight benchmark rate per 40 foot box (USD)   In our view, there has been one external factor where there has been a clear and marked deterioration, and that is the conflict over the Red Sea. Several shipping companies have already suspended shipments on the Red Sea routes due to the ongoing Houthi attacks, and in our latest note on Hungarian inflation, we’ve also discussed the effects of trade diversion. The impact of the Red Sea conflict on supply chains is already being felt as Suzuki halted the production of the Vitara and S-Cross models at its Esztergom, Hungary plant between 15 and 22 January. The shutdown was caused by delays in the delivery of Japanese engines. With shipping costs rising and supply chain disruptions already evident, we have identified the deterioration in external developments as the dominant factor that would affect the central bank's reaction function.

currency calculator