


By InvestMacro | COT | Data Tables | COT Leaders | Downloads | COT Newsletter
Here are the latest charts and statistics for the Commitment of Traders (COT) data published by the Commodities Futures Trading Commission (CFTC).
The latest COT data is updated through Tuesday May 17th and shows a quick view of how large traders (for-profit speculators and commercial entities) were positioned in the futures markets.
Energy market speculator bets were mixed this week as three out of the six energy markets we cover had higher positioning this week.
Overall, the energy markets with higher speculator bets this week were WTI Crude Oil (14,834 contracts), Gasoline (2,420 contracts) and the Bloomberg Commodity Index (3,624 contracts).
The markets with declining speculator bets this week were Brent Crude Oil (-3,652 contracts), Natural Gas (-2,483 contracts) and Heating Oil (-9,228 contracts).
| May-17-2022 | OI | OI-Index | Spec-Net | Spec-Index | Com-Net | COM-Index | Smalls-Net | Smalls-Index |
|---|---|---|---|---|---|---|---|---|
| WTI Crude | 1,730,665 | 0 | 325,637 | 7 | -363,869 | 95 | 38,232 | 69 |
| Gold | 555,756 | 30 | 175,360 | 33 | -206,879 | 65 | 31,519 | 48 |
| Silver | 144,534 | 11 | 16,114 | 38 | -24,841 | 75 | 8,727 | 0 |
| Copper | 189,483 | 19 | -24,408 | 25 | 23,059 | 75 | 1,349 | 33 |
| Palladium | 9,114 | 13 | -3,215 | 3 | 3,621 | 97 | -406 | 20 |
| Platinum | 65,926 | 32 | 2,203 | 7 | -6,697 | 96 | 4,494 | 25 |
| Natural Gas | 1,118,417 | 8 | -115,012 | 44 | 64,340 | 51 | 50,672 | 100 |
| Brent | 176,861 | 21 | -34,867 | 53 | 32,127 | 47 | 2,740 | 46 |
| Heating Oil | 349,618 | 31 | 6,455 | 52 | -32,434 | 37 | 25,979 | 88 |
| Soybeans | 709,144 | 24 | 183,647 | 73 | -156,937 | 33 | -26,710 | 26 |
| Corn | 1,548,438 | 29 | 473,743 | 91 | -424,756 | 11 | -48,987 | 15 |
| Coffee | 206,106 | 0 | 38,487 | 72 | -40,949 | 32 | 2,462 | 13 |
| Sugar | 825,281 | 6 | 196,630 | 77 | -245,374 | 22 | 48,744 | 68 |
| Wheat | 326,651 | 8 | 28,806 | 57 | -26,020 | 23 | -2,786 | 98 |
WTI Crude Oil Futures:
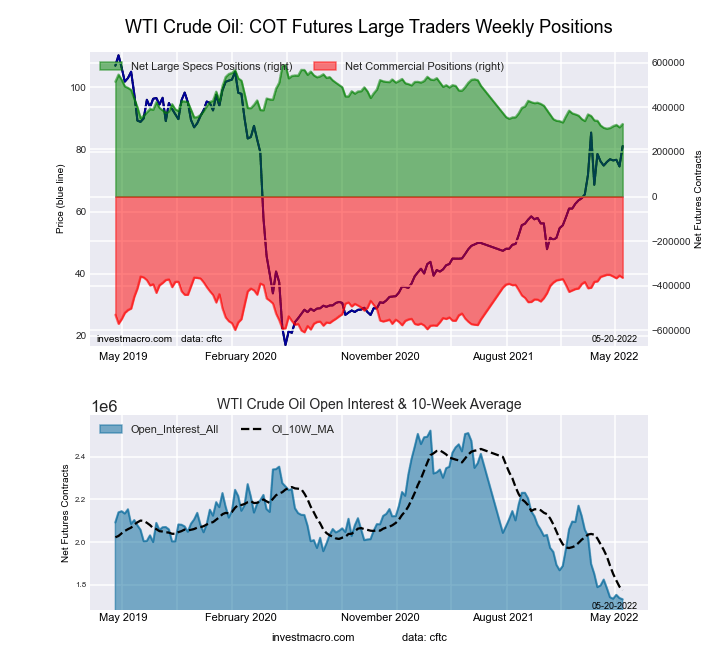 The WTI Crude Oil Futures large speculator standing this week totaled a net position of 325,637 contracts in the data reported through Tuesday. This was a weekly advance of 14,834 contracts from the previous week which had a total of 310,803 net contracts.
This week’s current strength score (the trader positioning range over the past three years, measured from 0 to 100) shows the speculators are currently Bearish-Extreme with a score of 7.3 percent. The commercials are Bullish-Extreme with a score of 94.9 percent and the small traders (not shown in chart) are Bullish with a score of 68.9 percent.
| WTI Crude Oil Futures Statistics | SPECULATORS | COMMERCIALS | SMALL TRADERS |
| – Percent of Open Interest Longs: | 24.0 | 35.3 | 5.1 |
| – Percent of Open Interest Shorts: | 5.2 | 56.3 | 2.9 |
| – Net Position: | 325,637 | -363,869 | 38,232 |
| – Gross Longs: | 416,190 | 611,264 | 88,406 |
| – Gross Shorts: | 90,553 | 975,133 | 50,174 |
| – Long to Short Ratio: | 4.6 to 1 | 0.6 to 1 | 1.8 to 1 |
| NET POSITION TREND: | |||
| – Strength Index Score (3 Year Range Pct): | 7.3 | 94.9 | 68.9 |
| – Strength Index Reading (3 Year Range): | Bearish-Extreme | Bullish-Extreme | Bullish |
| NET POSITION MOVEMENT INDEX: | |||
| – 6-Week Change in Strength Index: | 6.0 | -3.3 | -12.1 |
Brent Crude Oil Futures:
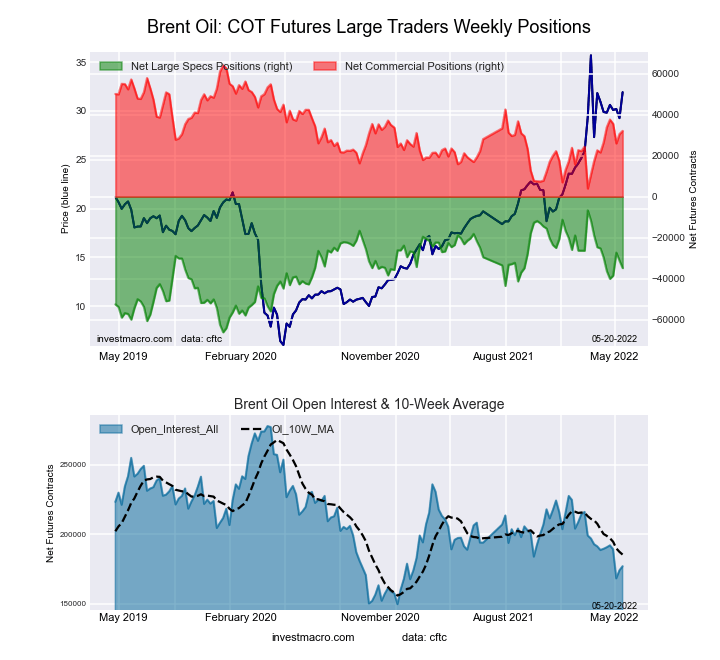 The Brent Crude Oil Futures large speculator standing this week totaled a net position of -34,867 contracts in the data reported through Tuesday. This was a weekly reduction of -3,652 contracts from the previous week which had a total of -31,215 net contracts.
This week’s current strength score (the trader positioning range over the past three years, measured from 0 to 100) shows the speculators are currently Bullish with a score of 52.7 percent. The commercials are Bearish with a score of 46.7 percent and the small traders (not shown in chart) are Bearish with a score of 46.3 percent.
| Brent Crude Oil Futures Statistics | SPECULATORS | COMMERCIALS | SMALL TRADERS |
| – Percent of Open Interest Longs: | 15.7 | 50.8 | 4.7 |
| – Percent of Open Interest Shorts: | 35.4 | 32.7 | 3.1 |
| – Net Position: | -34,867 | 32,127 | 2,740 |
| – Gross Longs: | 27,757 | 89,898 | 8,270 |
| – Gross Shorts: | 62,624 | 57,771 | 5,530 |
| – Long to Short Ratio: | 0.4 to 1 | 1.6 to 1 | 1.5 to 1 |
| NET POSITION TREND: | |||
| – Strength Index Score (3 Year Range Pct): | 52.7 | 46.7 | 46.3 |
| – Strength Index Reading (3 Year Range): | Bullish | Bearish | Bearish |
| NET POSITION MOVEMENT INDEX: | |||
| – 6-Week Change in Strength Index: | -8.7 | 9.3 | -5.9 |
Natural Gas Futures:
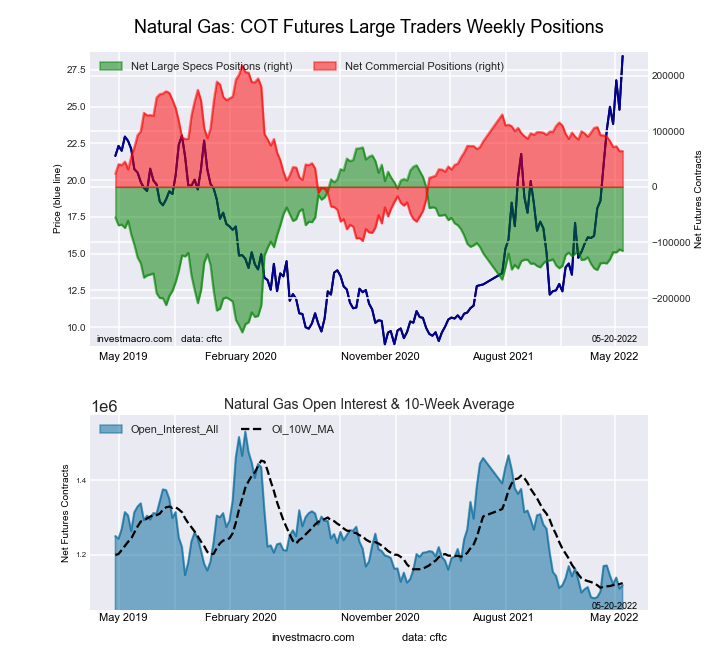 The Natural Gas Futures large speculator standing this week totaled a net position of -115,012 contracts in the data reported through Tuesday. This was a weekly lowering of -2,483 contracts from the previous week which had a total of -112,529 net contracts.
This week’s current strength score (the trader positioning range over the past three years, measured from 0 to 100) shows the speculators are currently Bearish with a score of 44.1 percent. The commercials are Bullish with a score of 51.1 percent and the small traders (not shown in chart) are Bullish-Extreme with a score of 100.0 percent.
| Natural Gas Futures Statistics | SPECULATORS | COMMERCIALS | SMALL TRADERS |
| – Percent of Open Interest Longs: | 20.7 | 37.5 | 6.8 |
| – Percent of Open Interest Shorts: | 31.0 | 31.7 | 2.2 |
| – Net Position: | -115,012 | 64,340 | 50,672 |
| – Gross Longs: | 231,576 | 419,033 | 75,523 |
| – Gross Shorts: | 346,588 | 354,693 | 24,851 |
| – Long to Short Ratio: | 0.7 to 1 | 1.2 to 1 | 3.0 to 1 |
| NET POSITION TREND: | |||
| – Strength Index Score (3 Year Range Pct): | 44.1 | 51.1 | 100.0 |
| – Strength Index Reading (3 Year Range): | Bearish | Bullish | Bullish-Extreme |
| NET POSITION MOVEMENT INDEX: | |||
| – 6-Week Change in Strength Index: | 6.5 | -9.0 | 15.8 |
Gasoline Blendstock Futures:
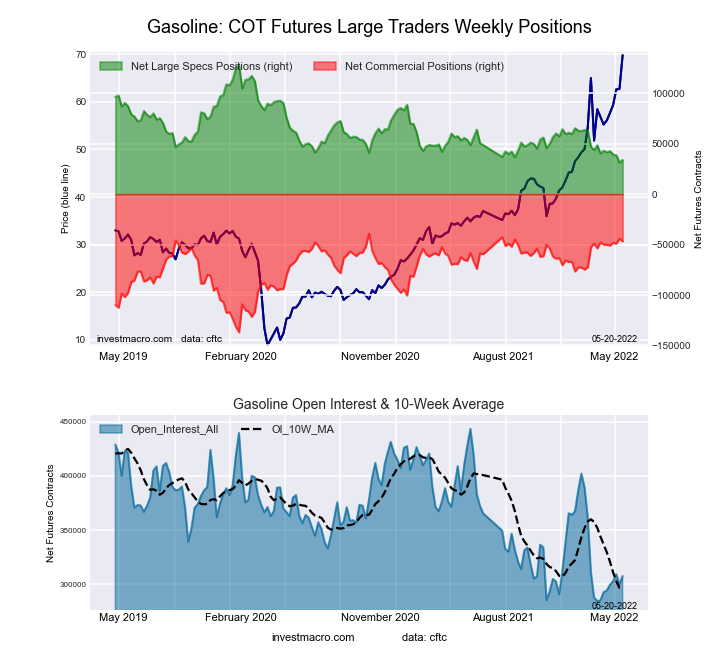 The Gasoline Blendstock Futures large speculator standing this week totaled a net position of 33,798 contracts in the data reported through Tuesday. This was a weekly increase of 2,420 contracts from the previous week which had a total of 31,378 net contracts.
This week’s current strength score (the trader positioning range over the past three years, measured from 0 to 100) shows the speculators are currently Bearish-Extreme with a score of 4.5 percent. The commercials are Bullish-Extreme with a score of 90.3 percent and the small traders (not shown in chart) are Bullish-Extreme with a score of 99.1 percent.
| Nasdaq Mini Futures Statistics | SPECULATORS | COMMERCIALS | SMALL TRADERS |
| – Percent of Open Interest Longs: | 24.6 | 52.8 | 7.9 |
| – Percent of Open Interest Shorts: | 13.6 | 68.0 | 3.7 |
| – Net Position: | 33,798 | -46,770 | 12,972 |
| – Gross Longs: | 75,744 | 162,371 | 24,256 |
| – Gross Shorts: | 41,946 | 209,141 | 11,284 |
| – Long to Short Ratio: | 1.8 to 1 | 0.8 to 1 | 2.1 to 1 |
| NET POSITION TREND: | |||
| – Strength Index Score (3 Year Range Pct): | 4.5 | 90.3 | 99.1 |
| – Strength Index Reading (3 Year Range): | Bearish-Extreme | Bullish-Extreme | Bullish-Extreme |
| NET POSITION MOVEMENT INDEX: | |||
| – 6-Week Change in Strength Index: | -9.3 | 3.3 | 39.2 |
#2 Heating Oil NY-Harbor Futures:
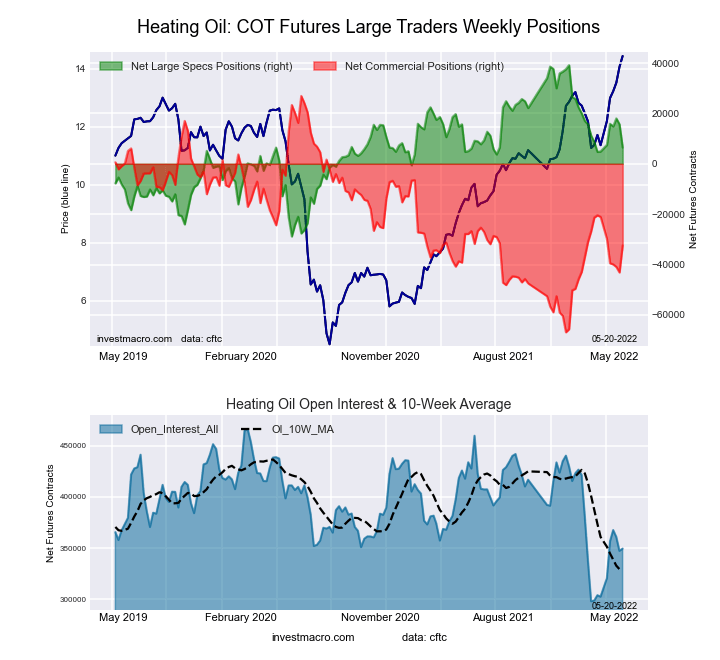 The #2 Heating Oil NY-Harbor Futures large speculator standing this week totaled a net position of 6,455 contracts in the data reported through Tuesday. This was a weekly decline of -9,228 contracts from the previous week which had a total of 15,683 net contracts.
This week’s current strength score (the trader positioning range over the past three years, measured from 0 to 100) shows the speculators are currently Bullish with a score of 51.9 percent. The commercials are Bearish with a score of 36.7 percent and the small traders (not shown in chart) are Bullish-Extreme with a score of 88.4 percent.
| Heating Oil Futures Statistics | SPECULATORS | COMMERCIALS | SMALL TRADERS |
| – Percent of Open Interest Longs: | 17.0 | 50.8 | 14.4 |
| – Percent of Open Interest Shorts: | 15.1 | 60.1 | 6.9 |
| – Net Position: | 6,455 | -32,434 | 25,979 |
| – Gross Longs: | 59,340 | 177,626 | 50,210 |
| – Gross Shorts: | 52,885 | 210,060 | 24,231 |
| – Long to Short Ratio: | 1.1 to 1 | 0.8 to 1 | 2.1 to 1 |
| NET POSITION TREND: | |||
| – Strength Index Score (3 Year Range Pct): | 51.9 | 36.7 | 88.4 |
| – Strength Index Reading (3 Year Range): | Bullish | Bearish | Bullish-Extreme |
| NET POSITION MOVEMENT INDEX: | |||
| – 6-Week Change in Strength Index: | 4.2 | -10.3 | 23.6 |
Bloomberg Commodity Index Futures:
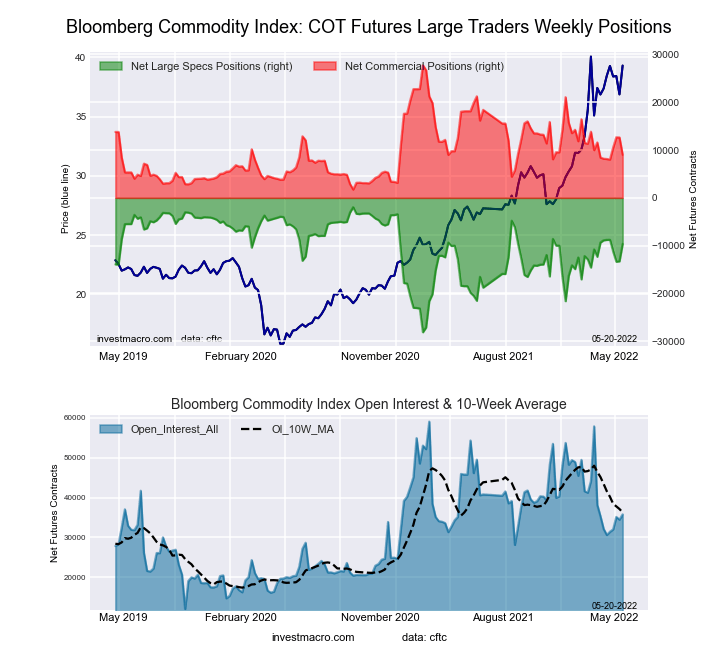 The Bloomberg Commodity Index Futures large speculator standing this week totaled a net position of -9,639 contracts in the data reported through Tuesday. This was a weekly advance of 3,624 contracts from the previous week which had a total of -13,263 net contracts.
This week’s current strength score (the trader positioning range over the past three years, measured from 0 to 100) shows the speculators are currently Bullish with a score of 70.6 percent. The commercials are Bearish with a score of 27.9 percent and the small traders (not shown in chart) are Bearish with a score of 42.1 percent.
| Bloomberg Index Futures Statistics | SPECULATORS | COMMERCIALS | SMALL TRADERS |
| – Percent of Open Interest Longs: | 67.2 | 25.2 | 2.0 |
| – Percent of Open Interest Shorts: | 94.1 | 0.0 | 0.2 |
| – Net Position: | -9,639 | 9,002 | 637 |
| – Gross Longs: | 24,050 | 9,002 | 715 |
| – Gross Shorts: | 33,689 | 0 | 78 |
| – Long to Short Ratio: | 0.7 to 1 | inf to 1 | 9.2 to 1 |
| NET POSITION TREND: | |||
| – Strength Index Score (3 Year Range Pct): | 70.6 | 27.9 | 42.1 |
| – Strength Index Reading (3 Year Range): | Bullish | Bearish | Bearish |
| NET POSITION MOVEMENT INDEX: | |||
| – 6-Week Change in Strength Index: | -2.9 | 3.1 | -1.8 |
Article By InvestMacro – Receive our weekly COT Reports by Email
*COT Report: The COT data, released weekly to the public each Friday, is updated through the most recent Tuesday (data is 3 days old) and shows a quick view of how large speculators or non-commercials (for-profit traders) were positioned in the futures markets.
The CFTC categorizes trader positions according to commercial hedgers (traders who use futures contracts for hedging as part of the business), non-commercials (large traders who speculate to realize trading profits) and nonreportable traders (usually small traders/speculators) as well as their open interest (contracts open in the market at time of reporting).See CFTC criteria here.


